GO AD-FREE. Get 2 Months Digital Subscription for ONLY £1! Use code 2FOR1
GET STARTEDMore on KentOnline
GO AD-FREE. Get 2 Months Digital Subscription for ONLY £1! Use code 2FOR1
GET STARTEDMore on KentOnline
Rates of Covid infection have gone above the national average in every Kent district apart from two.
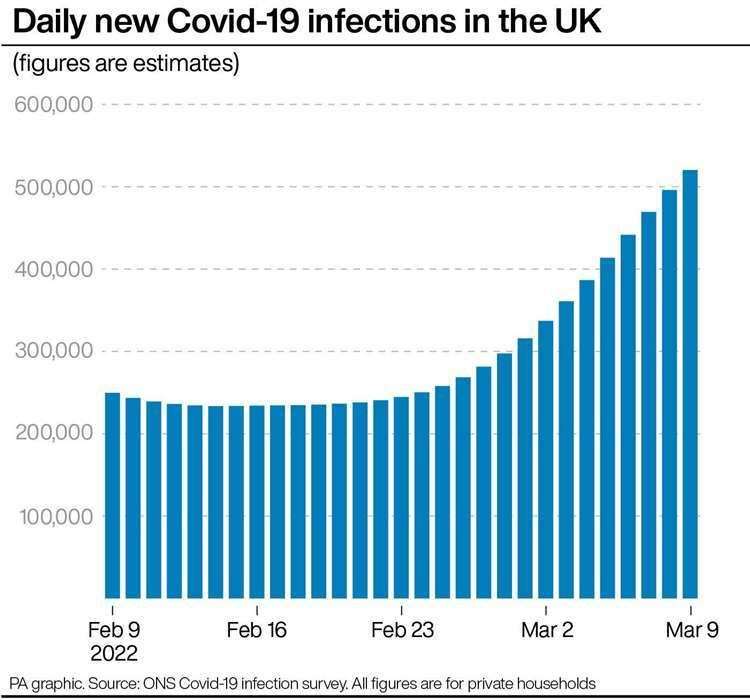
It comes an analysis suggests the number of new Covid-19 infections in the UK is likely to have climbed as high as half a million a day.

The average Covid infection rate in England now stands at 843.1 per 100,000 of the population, with only Dartford and Gravesham posting lower rates at 742.7 and 714.8 respectively.
The highest rates in Kent are in Thanet (1,164.3) and Ashford (1,161.7) according to the latest figures for the seven days up to March 20. The average rate across Kent, excluding Medway, is 981.1.
Thanet has also recorded the sharpest percentage increase, at 33.9%. Only Sevenoaks (8.2%) and Tunbridge Wells (7.8%) have seen a single figure increase. The average increase across the county is 16.2%.
The latest Covid statistics for Kent's districts are as follows. The figures show the number of new cases recorded over seven days; the infection rate per 100,000 people (in bold) and the percentage increase.
Ashford: 1,522; 1,161.7; 18.6%
Canterbury: 1,640; 983.4; 11.9%
Dartford: 847; 742.7; 17%
Dover: 1,326; 1,118.9; 22.2%
Folkestone & Hythe: 1,231; 1,086.3; 9.2%
Gravesham: 764; 714.8; 24.8%
Maidstone: 1,519; 877.4; 13%
Medway: 2,419; 866.6; 28.3%
Sevenoaks: 1,162; 957.3; 8.2%
Swale: 1,495; 990; 13.2%
Thanet: 1,647; 1,164.3; 33.9%
Tonbridge & Malling: 1,228; 926.3; 19.1%
Tunbridge Wells: 1,209; 1,016.5; 7.8%
Kent: 15,590; 981.1; 16.2%
Infections across the country are estimated to have more than doubled in the space of two weeks, from 244,600 per day by February 23 to 520,200 by March 9, according to new modelling published by the Office for National Statistics (ONS).
There were likely to have been 3.1 million new infections in the UK in the week to March 9 – eight times the number recorded on the government’s Covid-19 dashboard.
The figures suggest the virus could be circulating at levels higher even than those reached during the Omicron-led surge at the start of the year.
More data is needed before estimates can be made for the number of new infections in more recent days, however.
The modelling is based on results collected as part of the ONS weekly Covid-19 infection survey of private households.
Sample sizes are smaller for Wales, Scotland and Northern Ireland than they are for England, meaning margins of error are wide and care should be taken in interpreting results, the ONS said.
But the estimates point to a steep jump in new infections at the end of February and in early March, mirroring the sharp rise in the overall prevalence of the virus at the same time.
They also highlight just how many infections are being missed from the official figures published each day on the coronavirus dashboard.
The government figures have always under-represented the true level of Covid-19 in the country, because they only count people who have reported themselves as having tested positive.
This means they are affected by how many people are taking tests and choosing to report the results.
But the gap has grown wider since the start of the year, with the ONS estimate for new infections being around three times the equivalent dashboard total in January, five times by mid-February and now eight times the size.
Professor Kevin McConway, of the Open University, said the sharp difference between the two sets of figures is due chiefly to the huge drop in the number of people being tested, which has “fallen a lot” since the start of the year.
“If people aren’t being tested, or aren’t reporting the results, then the trends in dashboard case rates aren’t going to reflect what’s really going on in the country,” he said.
“That’s exactly why we need the ONS survey – it isn’t affected by that issue, because people are tested, regardless of symptoms, just to estimate how the pandemic is developing.”
Separate figures published by the ONS on Friday showed the total number of people likely to have coronavirus in the UK has risen from 2.4 million in the week to February 26 to 4.3 million last week.
The latest wave of infections is being driven by the Omicron variant BA.2, a more transmissable form of the virus, the ONS said.