GO AD-FREE. Get 2 Months Digital Subscription for ONLY £1! Use code 2FOR1
GET STARTEDMore on KentOnline
GO AD-FREE. Get 2 Months Digital Subscription for ONLY £1! Use code 2FOR1
GET STARTEDMore on KentOnline
The government is set to decide this week which areas of the UK will be subjected to the toughest restrictions - known as Tier 3.
It is thought the measures could be imposed on a district-by-district basis, with those with the highest rates being hit with the most stringent rules.

There is even the chance that individual towns, as opposed to boroughs or districts, are placed in separate tiers, with some council leaders arguing for this more localised approach.
So we've looked at the latest Public England Health figures to identify the areas with the highest infection rates in every area of Kent.
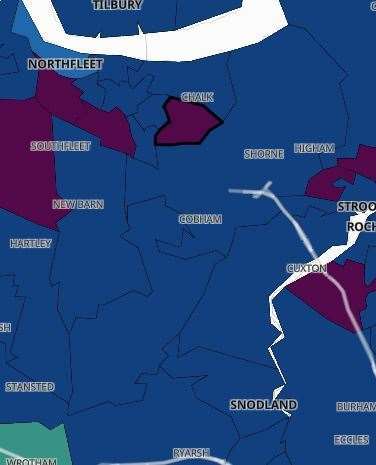
Those coloured purple have more than 400 weekly cases per 100,000 people, with dark blue signalling a rate of 201-400.
A lighter blue indicates a rate of 101-200, teal of 51-100 and green of 11-50.
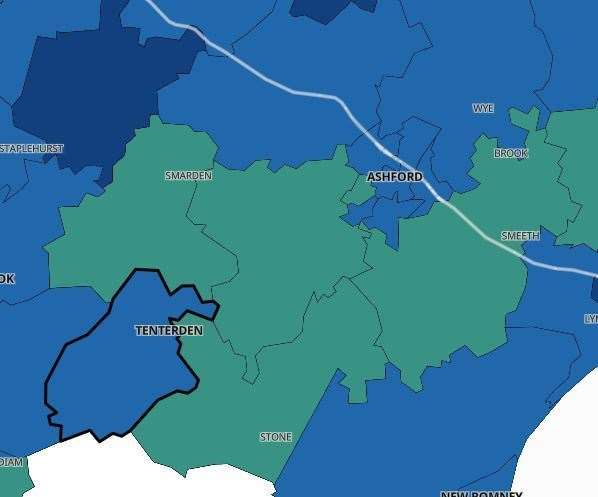
ASHFORD (123)
Tenterden and Rolvenden - 180
Ashford has Kent's lowest infection rate, so it's perhaps unfair to call any of its areas a Covid hotspot.
But 15 new cases in Tenterden and Rolvenden have seen its rate rise to 180 in the most recent week - a 150% jump, albeit from a low base of six cases the week before.
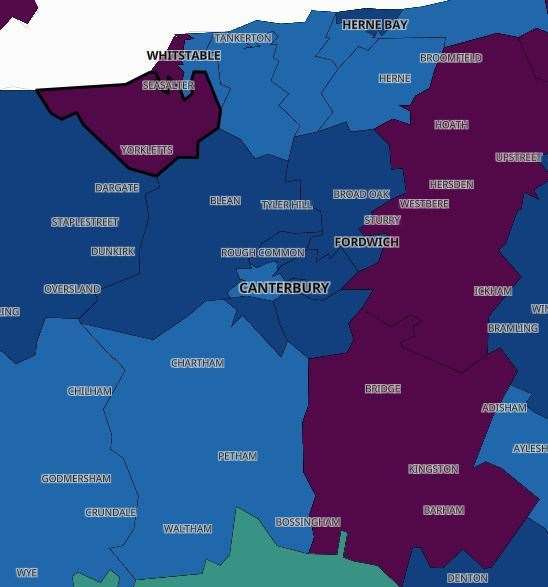
CANTERBURY (255.8)
Seasalter - 568.5
While the majority of cases have been seen in the area of the University of Kent in recent weeks, its a seaside hamlet on the outskirts of Whitstable which currently has the district's highest infection rate.
The area, which is home to a large number of holiday lets, recorded 51 new cases in the week up to November 16 - a rise of 32.
Canterbury City Council leader Ben Fitter-Harding is among those supporting a localised approach to restrictions.

DARTFORD (317)
Wilmington and Hawley - 582.6
Just two areas of Dartford are in the purple, with rates above 400.
But it's the villages of Wilmington and Hawley where it's highest, with 34 new cases recorded in the most recent week.
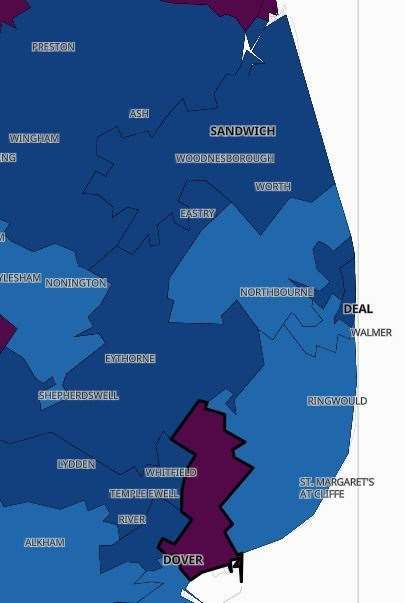
DOVER (233.6)
Dover East - 566.3
Forty-six new cases in week up to November 16 has seen Dover East's rate rise close to 600.
The area takes in Dover Docks and the town centre, and is the only place in the district in the purple.
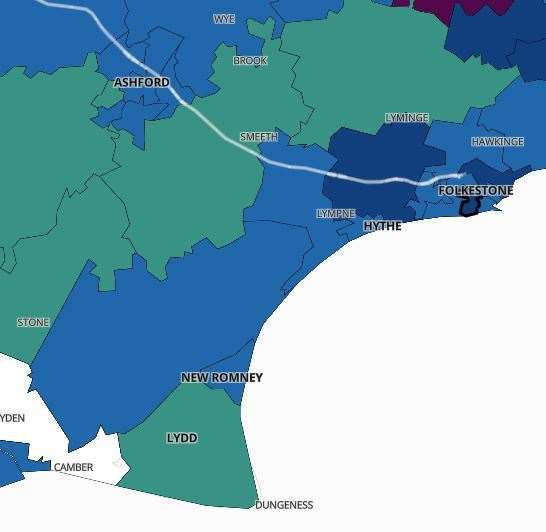
FOLKESTONE AND HYTHE (176.1)
Folkestone Central - 335
The district's rate remains one of Kent's lowest, but the number has crept above 300 in one area on Folkestone seafront.
Folkestone Central, where cases almost doubled to 24, takes in the majority of Sandgate Road and Folkestone beach.
GRAVESEND (334.8)
Riverview Park - 629.8
Cases have doubled to 44 in an area to the east of the town, seeing its rate rise above 600.
Riverview Park has Rochester Road as its northern boundary, and has many built up residential areas.
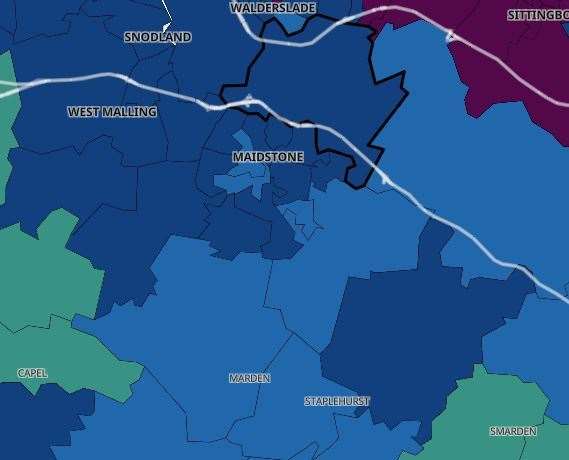
MAIDSTONE (237.4)
Boxley and Detling - 394
The centre of Maidstone town itself is escaping some of the outbreaks seen across the borough.
It's to the new north where rates are highest, with 28 new cases in an area containing the villages of Detling, Boxley and Bredhurst.
Its rate more than trebled to 394.
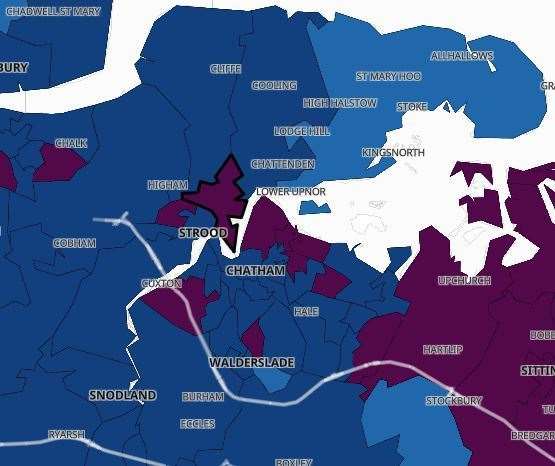
MEDWAY (343.3)
Wainscott and City Estate - 441.6
There were almost 1,000 new cases recorded across Medway in the week up to November 16 - a rise of almost 55%.
Thirty-seven of them were in an area bordering Strood and Rochester to the north.
Wainscott and City Estate is so-called because it is home to the village and Medway City Estate.
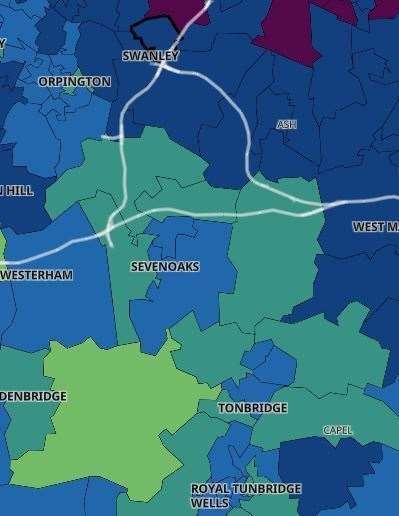
SEVENOAKS (200.4)
Swanley East and Hextable - 389.3
The district's infection rate has risen 44% in a week to creep above 200.
But the rate is highest in the north, in an area containing the village of Hextable and parts of Swanley town.
Cases there doubled from 14 to 28.
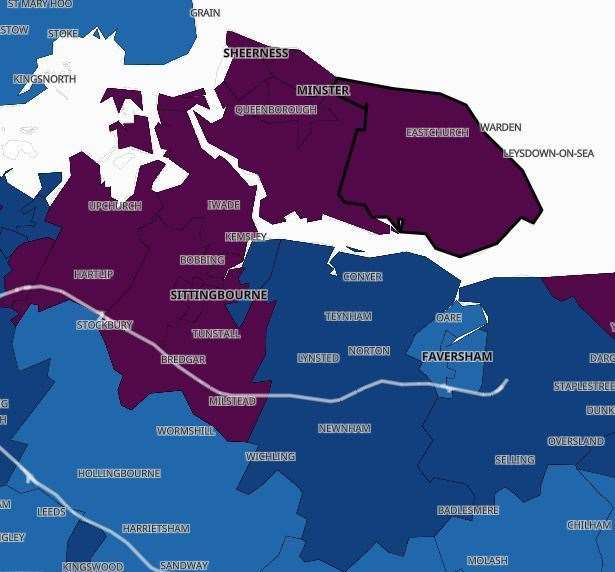
SWALE (655)
Sheppey East - 1,964
Swale has made uneviable headlines this week as areas of the borough record some of the highest in the country.
Sheppey East tops the national table, with its 170 new cases seeing its rate rise close to 2,000.
Prison outbreaks and mass testing are said to be a major factor in the spike.
Minster South also has a rate above 1,000, while Faversham could feel especially hard done by if tough restrictions are imposed across the borough.
Just 30 of the 983 cases recorded in Swale in the last week were in the market town.
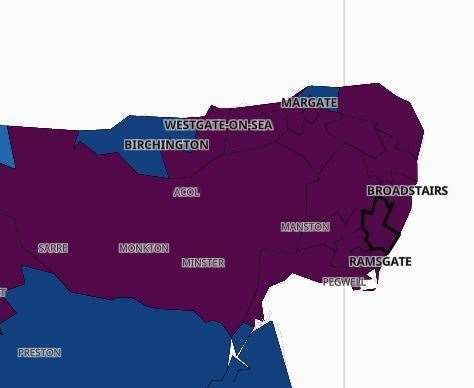
THANET (521.4)
Dumpton - 658.4
The majority of Thanet is in the purple, with a rate over 400, but its an area between Ramsgate and Broadstairs which tops the table.
There were 55 new cases in Dumpton in the most recent week - a rise of 150%.
The area's rate only pips Margate Town's by 0.1 weekly cases per 100,000 people.
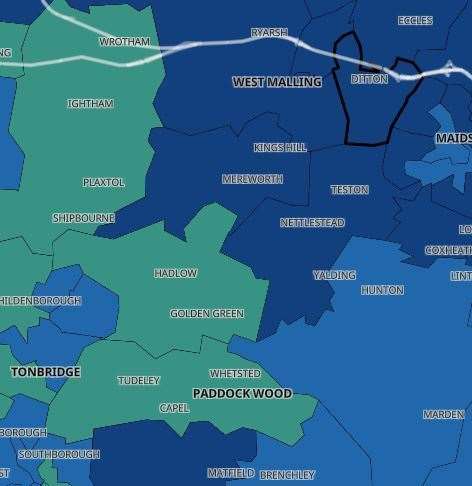
TONBRIDGE AND MALLING (196.7)
Ditton - 385.3
The borough's rate remains among the lowest in Kent, and is rising much more slowly than other parts of the county.
Its 15.6% increase is in large parts due to 27 new cases in the area of Ditton, which takes in the village itself and the Royal British Legion Village in Aylesford.
The RBL village provides housing, welfare support and care to over 300 members of the Armed Forces community.
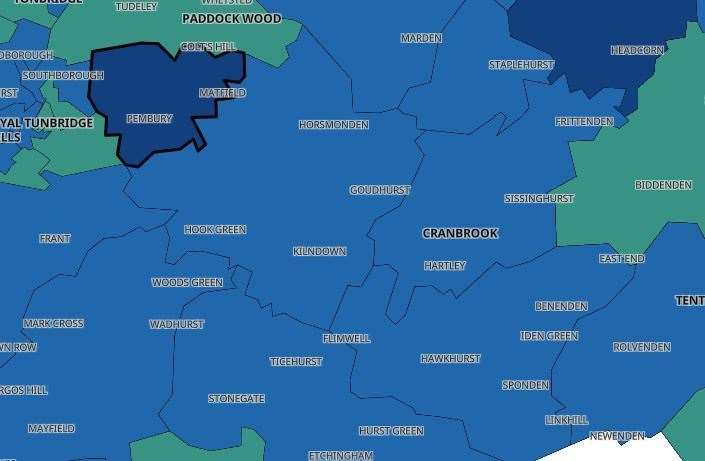
TUNBRIDGE WELLS (125.5)
Pembury and Matfield - 233.4
With just 149 new cases across the borough in the most recent week, the rate in Tunbridge Wells is in the second lowest in Kent.
The highest rate is to the east of town itself in an area containing the village of Pembury.
Cases there trebled to 18.