GO AD-FREE. Get 2 Months Digital Subscription for ONLY £1! Use code 2FOR1
GET STARTEDMore on KentOnline
GO AD-FREE. Get 2 Months Digital Subscription for ONLY £1! Use code 2FOR1
GET STARTEDMore on KentOnline
The number of daily Covid infections in Kent have fallen to their lowest level since last summer - but five areas of the county are still seeing rates above the national average.
Office for National Statistics (ONS) figures show there were an estimated 1.5 million people in private households with the virus in the week to May 7, down from two million the previous week.

The average Covid infection rate in England stands at 107.9 per 100,000 of the population, according to the statistics.
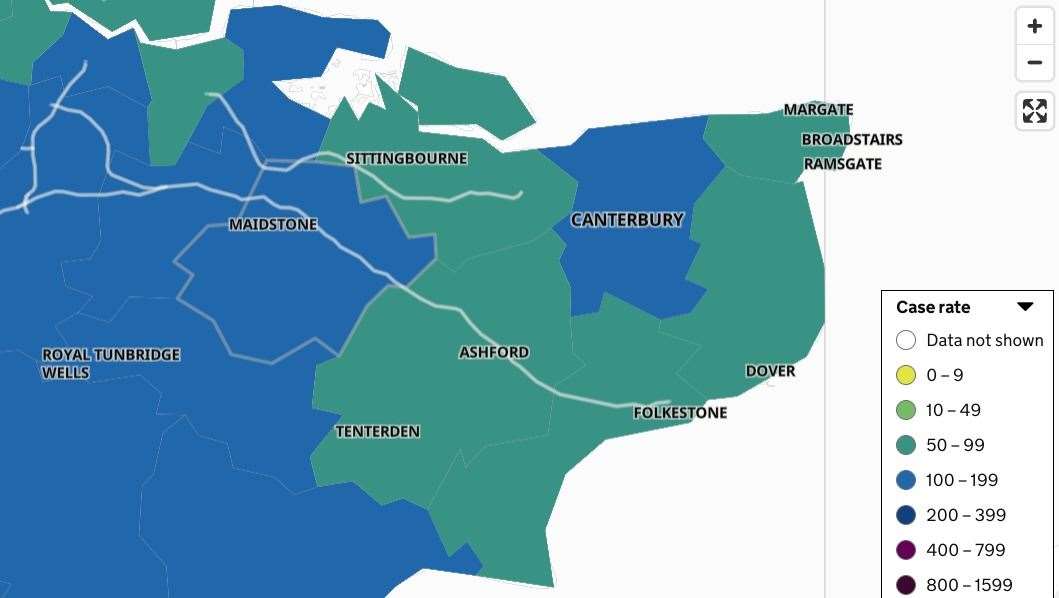
Five areas of Kent have higher rates.
Maidstone tops the table with 122 people in every 100,000 having tested positive for Covid. The town is followed by Tunbridge Wells (117.7), Dartford (115.7), Canterbury (111.5) and Tonbridge and Malling (110.9).
The average infection rate across Kent, excluding Medway, is 98.5.
Maidstone has also recorded the sharpest percentage increase, at 31.1%.
Other areas seeing a rise in cases are Sevenoaks (5.2%), Canterbury (3.9%) and Tonbridge and Malling (1.4%).
Across the county on average, however, cases have fallen by 7.4%.

The latest Covid statistics for Kent's districts are as follows. The figures show the number of new cases recorded over seven days; the infection rate per 100,000 people (in bold) and the percentage increase.
Ashford: 111; 84.7; -13/3%
Canterbury: 186; 111.5; 3.9%
Dartford: 132; 115.7; -1.5%
Dover: 102; 86.1; -22.1%
Folkestone & Hythe: 89; 78.5; -29.4%
Gravesham: 92; 86.1; -17.1%
Maidstone: 211; 121.9; 31.1%
Medway: 285; 102.1; -5.3%
Sevenoaks: 122; 100.5; 5.2%
Swale: 129; 85.4; -3.7%
Thanet: 105; 74.2; -38.6%
Tonbridge & Malling: 147; 110.9; 1.4%
Tunbridge Wells: 140; 117.7; -10.3%
Kent: 1,257; 98.5; -7.4%
In Kent the daily number of Covid cases has continued to fall since a small spike in mid-March. They are now at levels not seen since last June, although that may be in part due to a drop in testing.
Since April, most people have not been entitled to free lateral flow tests.
Most people with symptoms cannot order free PCR tests either, and rules on what to do if you test positive have also been relaxed.
In England, reported infections have fallen for the fifth week running, with 1.2 million people likely to test positive for Covid-19, the equivalent of about one in 45 people.
This is down from 1.6 million, or one in 35, and is the lowest estimate since the week ending December 16.