GO AD-FREE. Get 2 Months Digital Subscription for ONLY £1! Use code 2FOR1
GET STARTEDMore on KentOnline
GO AD-FREE. Get 2 Months Digital Subscription for ONLY £1! Use code 2FOR1
GET STARTEDMore on KentOnline
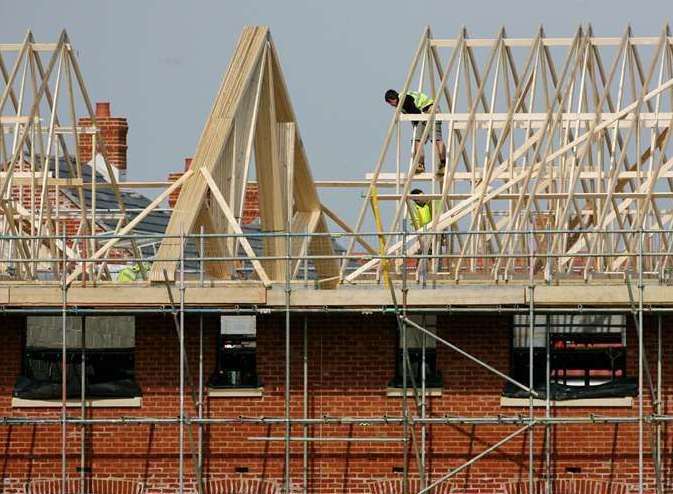
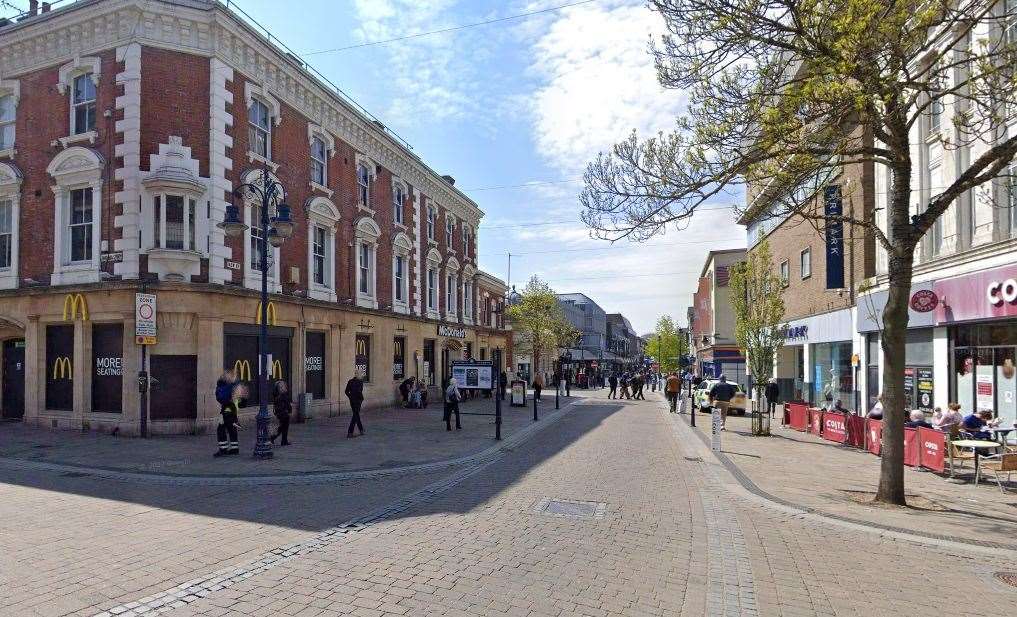
Given the scale of housebuilding in the county, the assumption would be that Kent’s population has rocketed over recent years. The reality, however, may come as a surprise.
Because despite perceptions, figures published recently show the population in Kent between 2021 and 2022 rose by less than 1%.

That’s the equivalent of just 14,600 people. One district saw no change in its numbers.
The 0.93% hike in Kent is lower than the 1% rise seen overall in England.
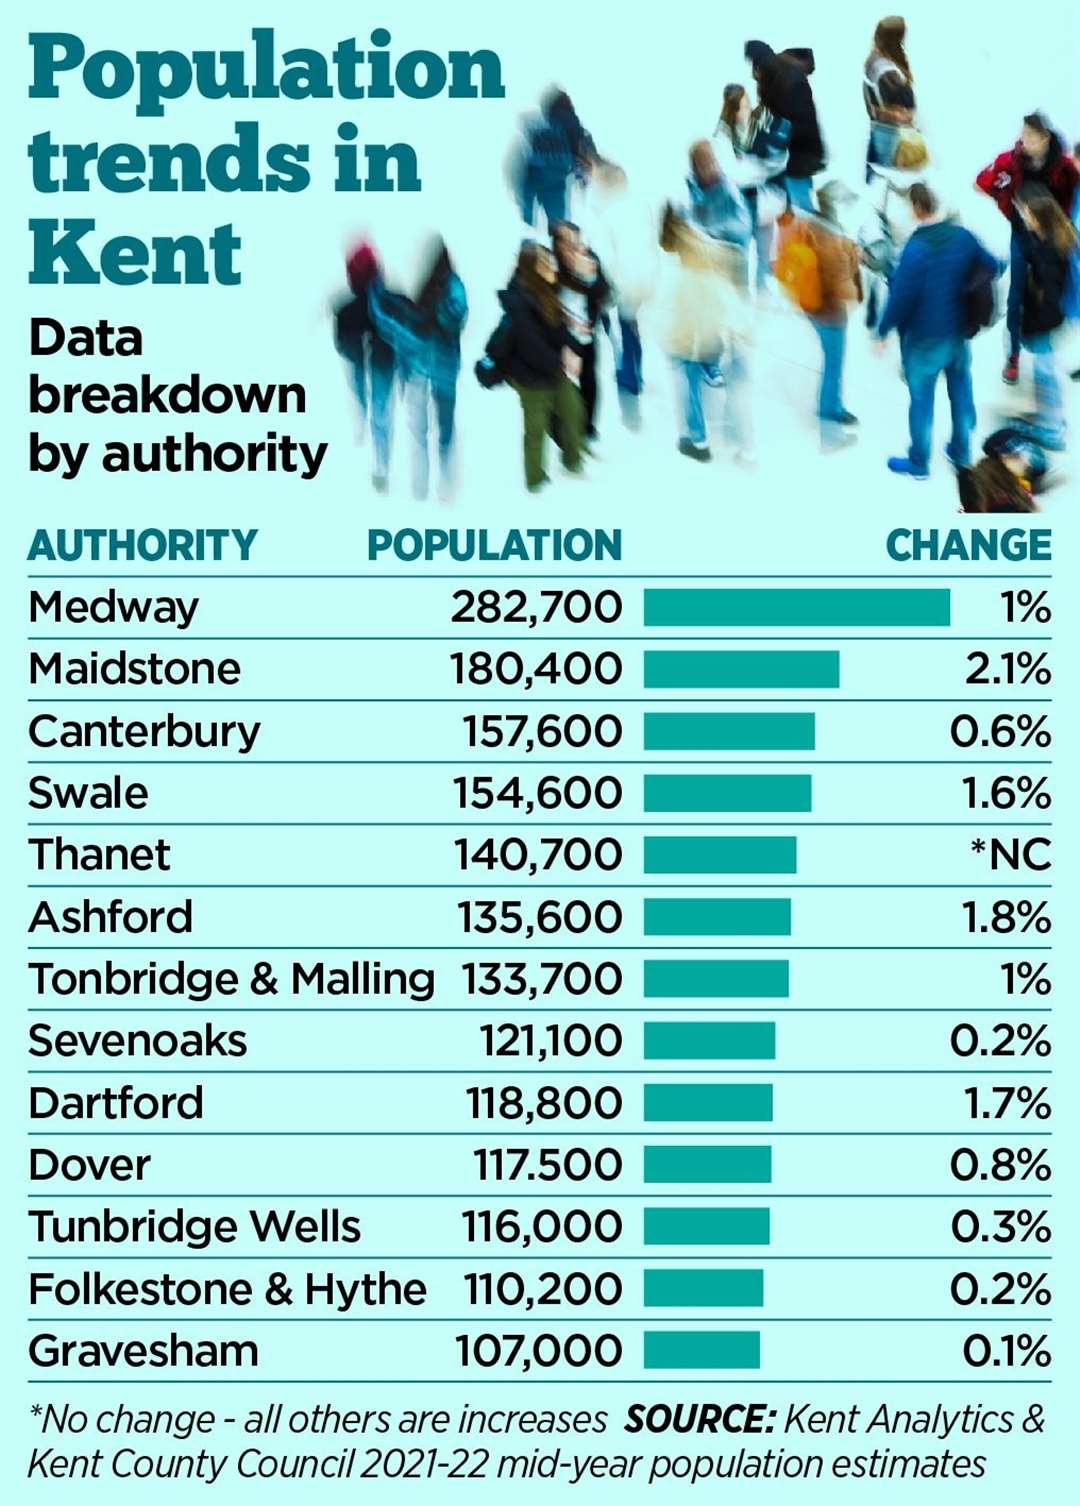
Between 2021-22, Medway toes the average increase with a 1% rise to 282,700 – up 2,800.
Oxfordshire saw the biggest increase in the South East of 1.58% – up some 11,500 people.
The Office for National Statistics (ONS) publishes population figures, with Kent County Council aggregating the local figures. It can also determine the most – and least – densely populated districts and those with the largest populations. Medway, as a unitary authority, does the same with its figures.
The 14,600 (or 17,400 if we include Medway) rise compares with figures from the ONS which suggest 6,820 new homes were built in the county over the same period. Combined, our local authorities have pledged to build at least 11,670 homes every year, as outlined in their Local Plans.
So what is driving the population increase?
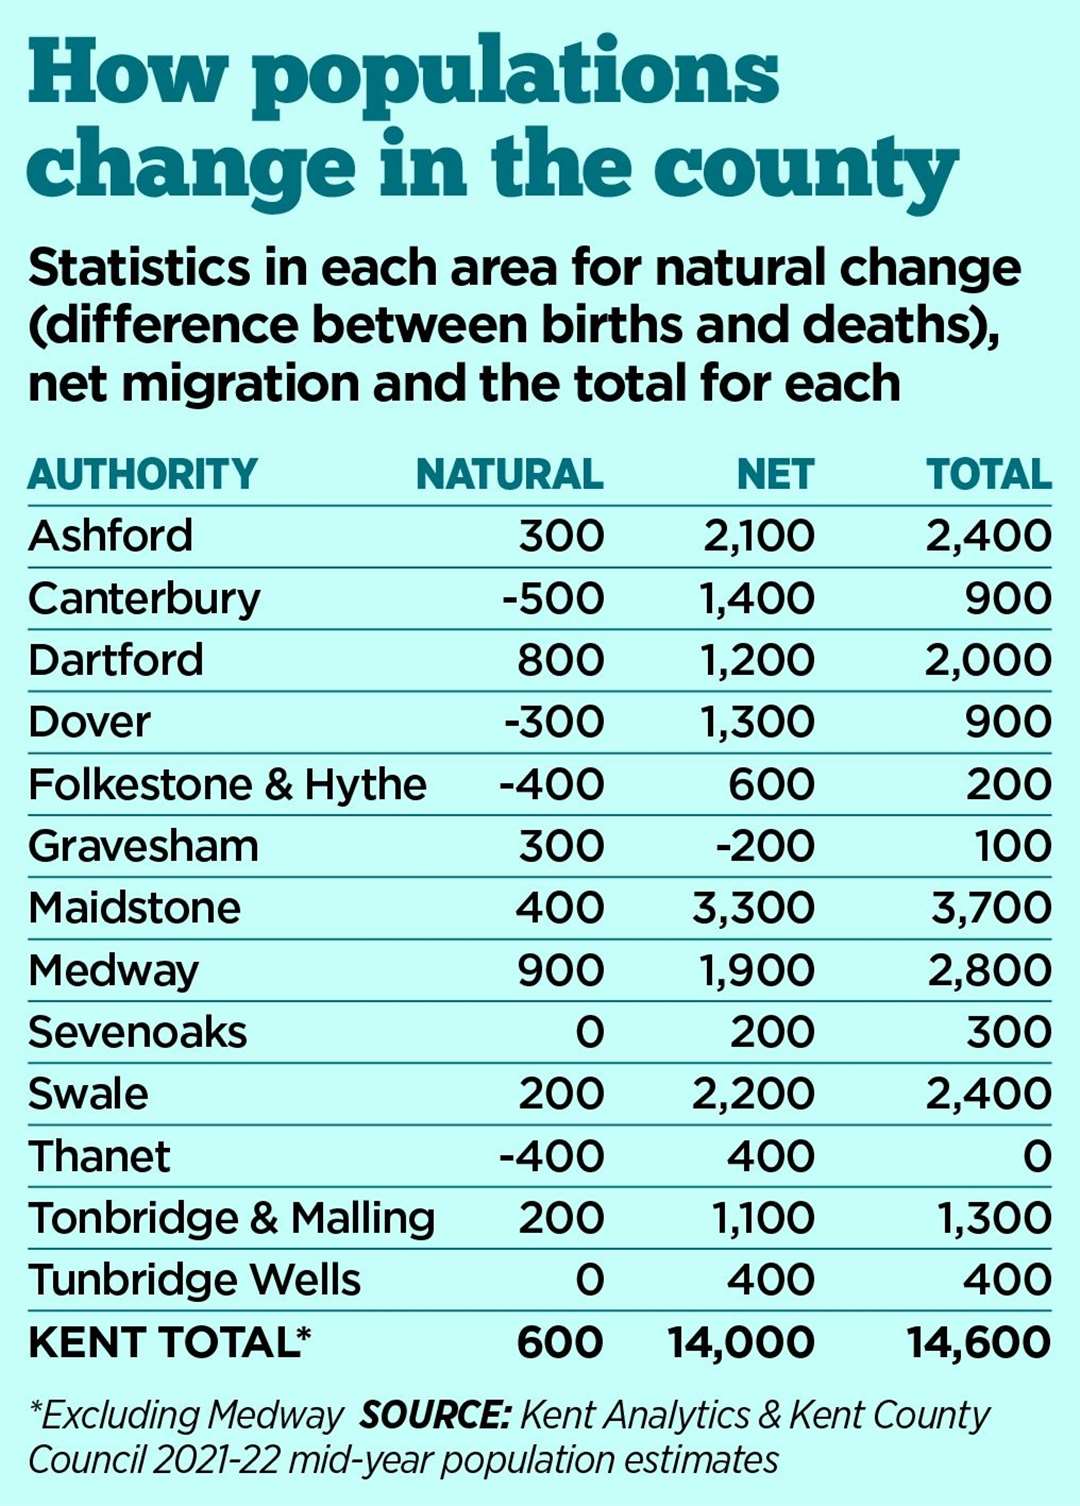
Kent County Council’s Kent Analytics explains: “Kent’s population grew by 14,600 people between mid-year 2021 and mid-year 2022. This is a result of a net figure of 14,000 people moving into Kent and an increase of 600 people through natural change – more births than deaths. These figures equate to a 95.7% increase due to net migration and a 4.3% increase due to natural change.”
That migration figure, it’s important to note, applies to those simply moving into the county from elsewhere in the UK – such as Down From Londoners (DFLs) – as well as those from outside our shores.
Net migration into the county is at a 10-year high – and close to double what it was in 2010-11 (7,500). In Kent, it now represents some 95.9% of our population growth.
Nationally, it accounts for 90.4% of the population increase.
Over the last 20 years, the county’s population has increased by 19% – in excess of the 15% average growth over the same period across England.
All of which suggests the county is proving an attractive location to relocate to for many.
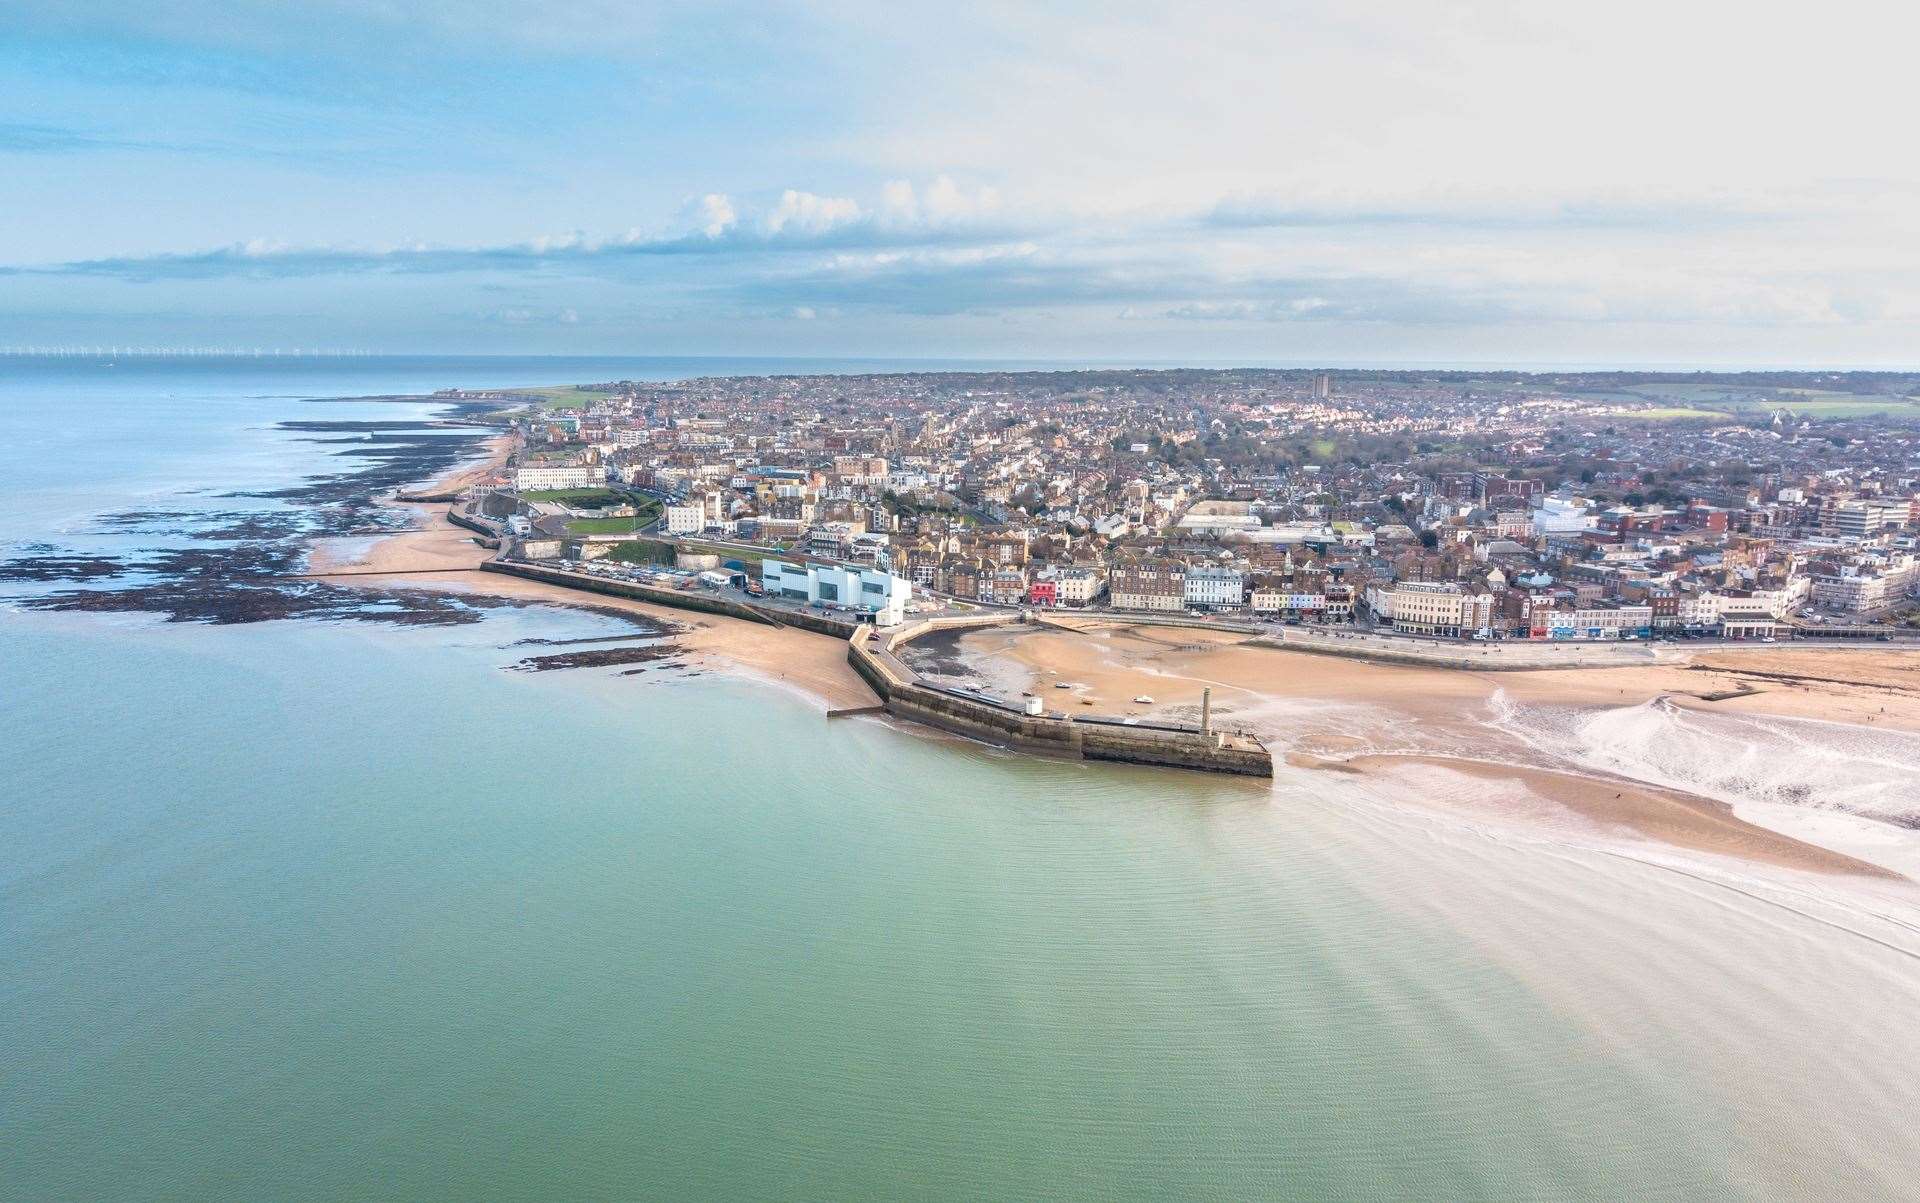
Drilling down into each district, Thanet saw no overall increase in its population over the 12 months. Which may surprise many who will reflect on the recent housebuilding there. It is, however, third only to Dartford and Medway when it comes to being the county’s most densely populated area.
Thanet has an average of 13.6 people per hectare (10,000 sq metres), while Medway has 14.6. Dartford is top of the tree at 16.3 – its population increased 1.7% (2,000 people).
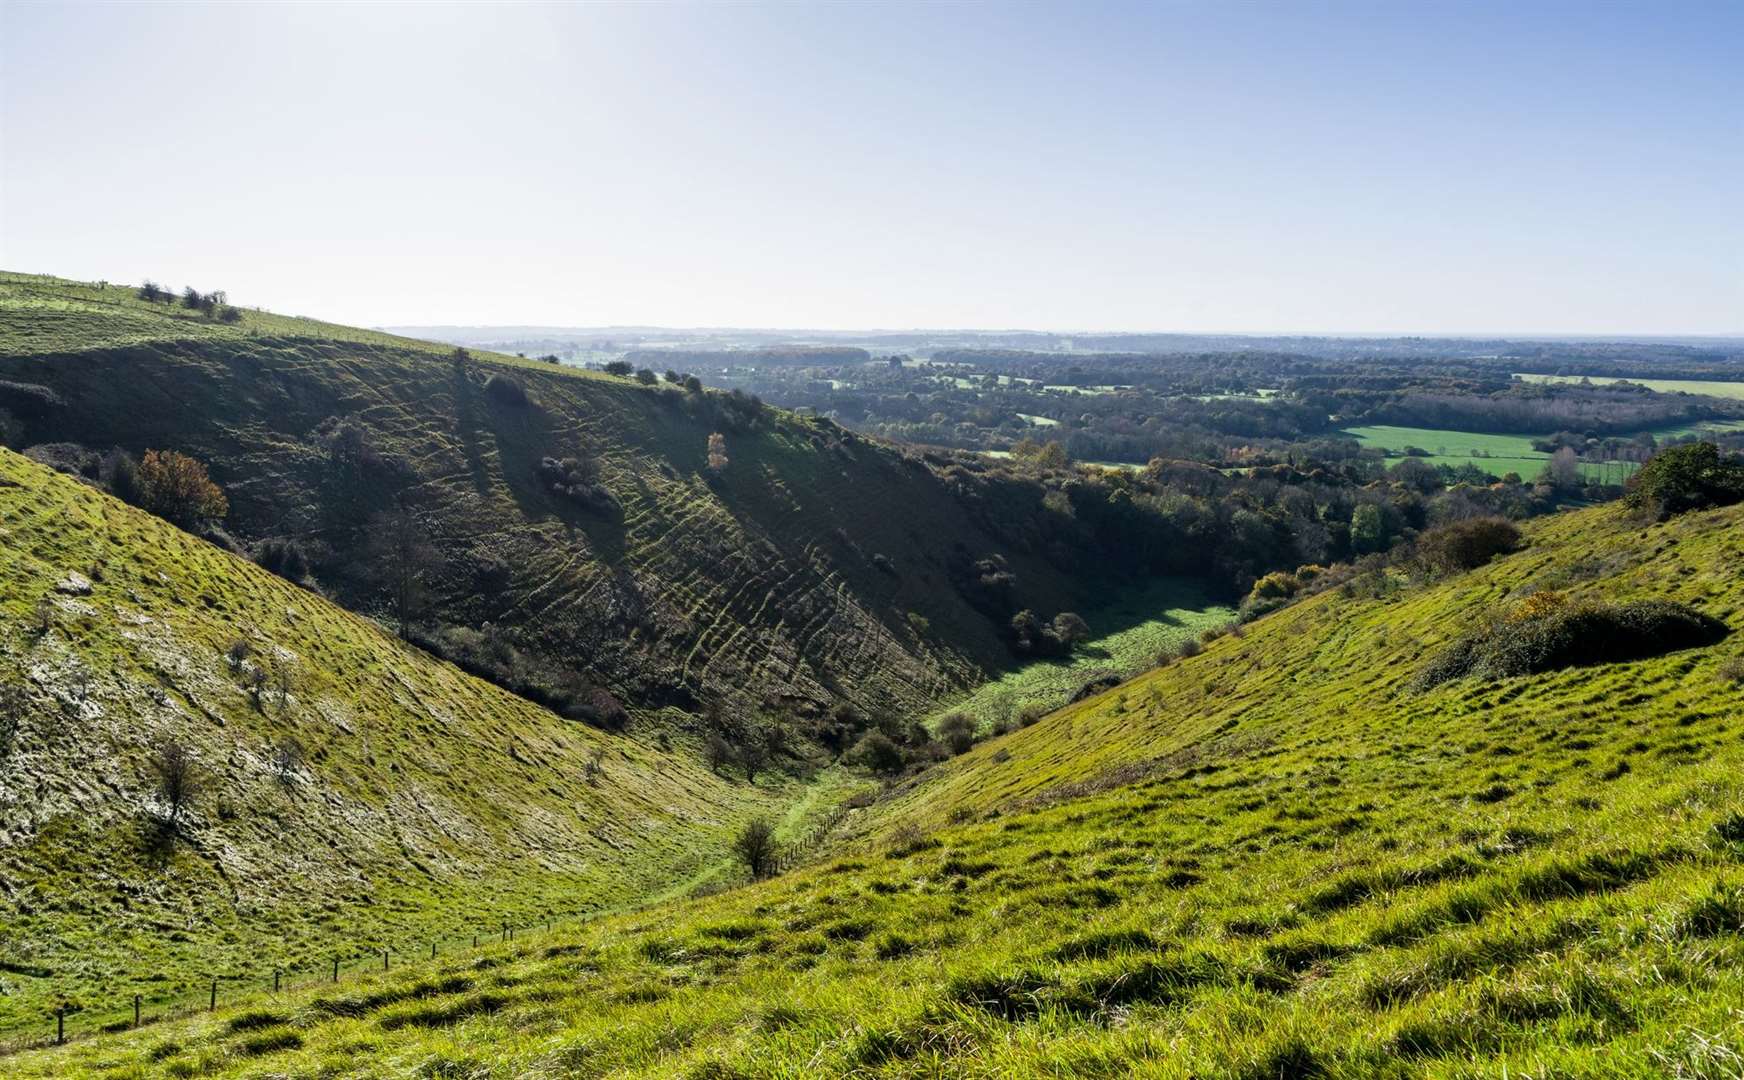
At the other end of the density scale is Ashford. The district, much of which is countryside, has just 2.3 people per hectare. Next is Folkestone and Hythe on 3.1. Sevenoaks – much of which sits within the protected Green Belt – averages 3.3 people per hectare.
Ashford did see the second-highest population increase, however. It jumped up 1.8% (the equivalent of 2,400 more residents).
Gravesham, Folkestone & Hythe, Sevenoaks and Tunbridge Wells all saw fewer than 500 people added to their headcount.
KCC’s Kent Analytics team explains: “In four of Kent’s local authority districts there were more deaths than births which resulted in a negative natural change. These are Canterbury, Dover, Folkestone & Hythe and Thanet.
“These areas have an older age profile than the rest of Kent so will naturally experience higher numbers of deaths to births. All of these areas experienced higher net migration which resulted in population growth in all areas except Thanet where the population remained the same between 2021 and 2022.
“Although Canterbury has a younger profile than Kent as a whole, the birth rate here is low due to the high student population.
“Gravesham is the only local authority in Kent to experience negative net migration resulting from more people leaving Gravesham than moving in. There were more births than deaths in Gravesham which resulted in an extra 300 people due to natural change. This resulted in a growth in population of 100.”
The mid-year population estimates underline Kent as being the most populous county council area in the South East with a population of 1,593,200. Surrey, in case you were interested, is the most densely packed of the Home Counties at 7.3 people per hectare. In contrast, London, not surprisingly, trumps all at 56.4.
Kent remains the largest non-metropolitan local authority area in England. Hampshire is next biggest with a population of 1,416,800. Our closest neighbour, East Sussex, is the smallest with a population of just 550,700.
Nationally, the 2022 mid-year population estimate for England is 57,106,400 – up 551,500 people, or 0.98% over the course of the year.
Back to Kent and this year’s increase of 14,600 represents the biggest over the last 10 years.
Since the 2010-2011 estimates, the county has gained, on average, a modest 11,500 each year.
Reflecting on how the figures have changed, KCC’s Kent Analytics said: “Population change for each Kent district are broadly similar to the county profile. However, there are some local variations.
“Natural change in the coastal districts of Dover, Folkestone & Hythe and Thanet has historically been negative, meaning that there are more people dying than are being born. This is attributed to the older age profile of these districts.
“Canterbury is another district which has historically seen negative natural change but for different reasons. Canterbury has a young age profile, due to it being a university city.
“However, fewer young women are bearing children. The low fertility rate in the district is outweighed by the number of deaths, causing negative natural change. Within these districts, all population change has been a result of net migration.
“Gravesham is the only area to experience a more even balance of natural change and net migration than Kent as a whole, between 2011 and 2015. However, recent years have seen Gravesham’s population change because of a higher natural change and negative net migration.
“During 2019/20 Sevenoaks has seen negative natural change for the first time since 2001/02. In Tunbridge Wells, although natural change has always been positive, it has fallen steadily since 2011. Net migration has fluctuated considerably over the same time scale and during five of the past 11 years Tunbridge Wells has seen negative net migration. However, since 2019/20 the net migration has increased and accounts for the total population growth in Tunbridge Wells.
“Although there has been positive natural change in Ashford, Dartford, Maidstone, and Swale, and Tonbridge & Malling net migration has been greater.”

Summary of each district’s population over the last 10 years:
Ashford: The mid-year population for the district in 2022 stood at 135,600 – accounting for some 8.4% of the county’s total (excluding Medway). That’s the equivalent of 2.3 people per hectare – the lowest in the county. The district does, however, cover the widest area, comprising of just over 58,000 hectares of land. The 2,400 annual increase (1.8% up) was the biggest the district has seen for the last 10 years. On average, since 2010-11, its population has increased by 1,700 each year.
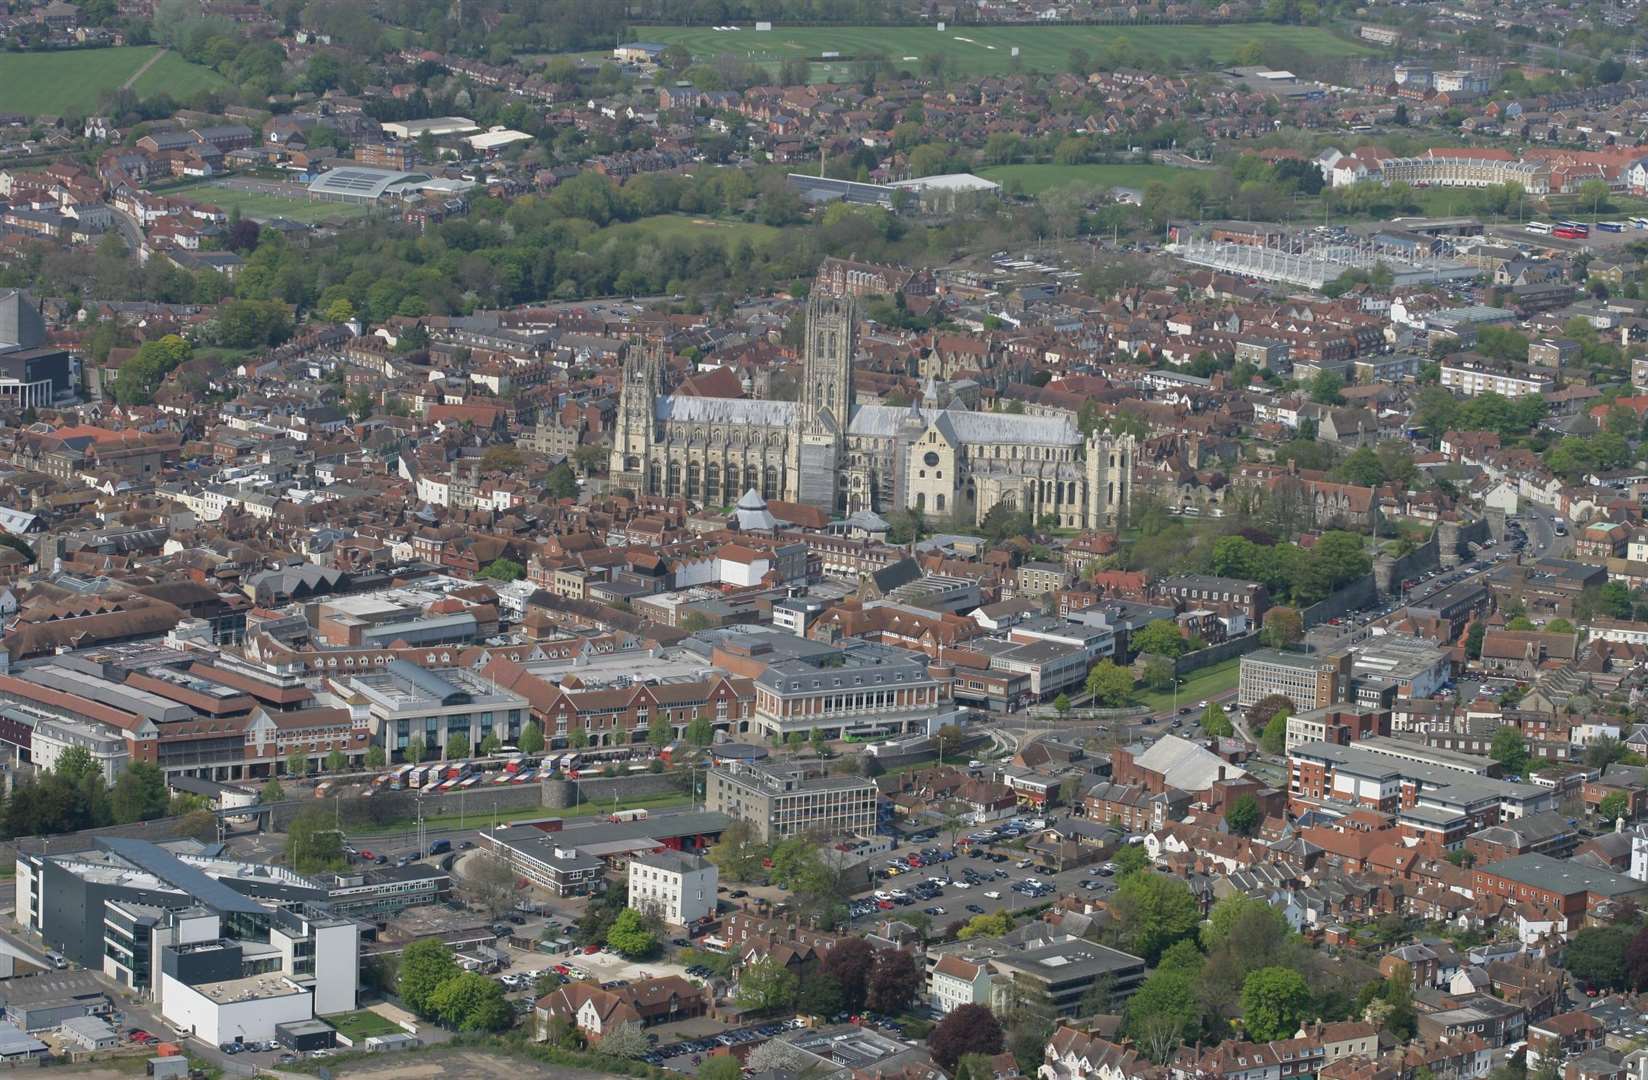
Canterbury: The district – which includes Whitstable and Herne Bay – saw its population increase by 900 to 157,600 (up 0.6%). It is the county’s second highest populated area accounting for 9.9% of Kent’s total (excluding Medway). Covering almost 30,900 hectares, it means there is an average 5.1 people per hectare – the fifth most densely populated district in the county. Its population decreased slightly in 2017-18, 2018-19 and 2020-21 due to a combination of both more deaths than births and a big drop in migration to the area. Its population, over the last 11 years, has increased by around 600 people a year on average.
Dartford: At an average of 16.3 people per hectare, it is the most densely populated district in the county due, no doubt, to its proximity to London. It is also the smallest district in Kent covering just under 7,300 hectares. Its mid 2022 population figure stood at 118,800 – accounting for 7.4% of the county’s total (excluding Medway). That is up 2,000 over the 12 months – 40% due to a higher number of births than deaths and 60% net migration (one of the lowest figures it has been in the last 11 years). It’s had an annual increase of 1,900 people per year since 2011-12.
Dover: More deaths than births has been the case for the port town since 2013-14. Which means its year-on-year population growth has been exclusively down to net migration. And this year was the highest over the last 10 years. Its population increased by 900 (up 0.8%) – rising, on average, just over 500 a year since 2011-12. Its current mid-year estimate for 2022 stands at 117,500 (7.4% of Kent’s total population, excluding Medway). It is one of the least densely populated parts of the county, however, with an average of 3.7 people per hectare.
Folkestone & Hythe: Like neighbouring Dover, deaths have comfortably outweighed births over recent years, while net migration has fluctuated during the same period. It’s population, according to the mid-year estimates, was 110,200 (7% of Kent’s population, excluding Medway) – up just 200 people (or 0.2%) and that despite its increasing popularity. In fact, its population has actually decreased over three of the last 10 years. It’s average growth since 2011-12 has been less than 200 people a year. It is also one of the county’s least densely populated areas – second only to Ashford – at 3.1 people per hectare.
Gravesham: Given its proximity to London, the assumption would be that Gravesend would be seeing rapid growth. Yet by mid 2022, its overall population increased by just 100 people. It had actually seen a decline over the previous two years. Net migration was negative in the latest figures – the sixth time in the last seven years that has been the case. On average, since 2011-12, its population has risen by less than 500 people each year. But then it is Kent’s least populated area with a population of 107,000 (just 6.8% of the county’s top number). It is however, densely populated compared to some of its neighbours with 10.8 people per hectare.
Maidstone: As the county town, you’ll not be surprised to learn Maidstone is home to the biggest chunk of Kent’s population. It’s 180,400 is comfortably the county’s largest (excluding Medway) and accounts for 11.3% of Kent’s population. It saw a 3,700 increase in the mid-2022 figures – a rise of 2.1%. Its population has grown, on average, by about 2,200 a year. There are comfortably more births than deaths and net migration is high too, all contributing to what is the biggest rise across both Kent and Medway. As for population density? It’s about 4.6 people per hectare – roughly in keeping with Kent’s average (4.5%).
Medway: Comprising Rochester, Gillingham and Chatham as its main towns, it is perhaps little wonder Medway is the single most populated part of the county. The mid-2022 estimate suggests some 282,700 call it home – up 1%, or 2,800, on the year before. It is second only to Dartford in terms of how densely populated the area is, with an average of 14.6 people per hectare. It has, however, been heavily reliant on there being more births than deaths with more people leaving the area than migrating to it over the previous five years. On average, its population has increased by around 1,600 since 2011-12.
Sevenoaks: While one of the largest districts at 37 hectares, having a large chunk being Green Belt means population growth always has something of a collar on it. However, it was still up 300 (0.2%). Natural change was static (in other words, births and deaths cancelled each other out), but 200 had the necessary deep pockets to move into the district. Its population at the mid-2022 point was 121,100 (or 7.7% of the county’s population, excluding Medway). From a density point of view, it has just 3.3 people per hectare.
Swale: The district has seen steady growth across its broad patch – which stretches from Faversham to Sittingbourne and across Sheppey. It saw one of the biggest population increases – up 2,400 people or 1.6% (behind only Maidstone and Ashford. The mid-year estimate puts its population at 154,600. It has seen its population grown by just over 1,800 a year for the past decade. There are, on average, around 4.1 people per hectare.
Thanet: For all the talk of DfLs flocking to Thanet and the extensive housebuilding which continues, net migration has been relatively sluggish over recent years. The 400 people moving to the area between 2021-22 was cancelled out by deaths outweighing births, meaning it was the only district in the county not to see a population increase. In fact, more deaths than births and a negative net migration figure meant its population actually declined in two of the previous three years. In fact, on average, its population has risen by a mere 500, on average, since 2011-12. However, with a population of 140,700 it remains one of the most densely populated at 13.6 people per hectare.
Tonbridge & Malling: After two years in which the population lifted by just 900 people in total, Tonbridge & Malling saw its head count increase by 1% (or 13,000) according to the mid-2022 estimate on the 12 months before. It brings the total to 133,700. The numbers were swollen by both more births than deaths and net migration. On average, since 2011-12, it has seen an increase of around 1,100 people a year. Spread across its 24,000 hectares, it equates to around 5.6 per hectare.

Tunbridge Wells: You’d think Tunbridge Wells was a place which would be a magnet to many given its affluence and proximity to the capital. But, in fact, it’s had one of the most modest population increases over the years of all of Kent. On average, just 150 people a year have been added to its headcount since 2011-12. The mid-2022 numbers saw a rise of 400 – all courtesy of net migration – to a total of 116,000. In fact deaths and births in the district have cancelled each other out for the two previous years too. However, between 2011 and 2015, more people left the borough than moved in. Density wise? Tunbridge Wells has about 3.5 people per hectare.