GO AD FREE | Get your Digital Subscription for only 50p a week! Use code SUMMER
GET STARTEDMore on KentOnline
GO AD FREE | Get your Digital Subscription for only 50p a week! Use code SUMMER
GET STARTEDMore on KentOnline
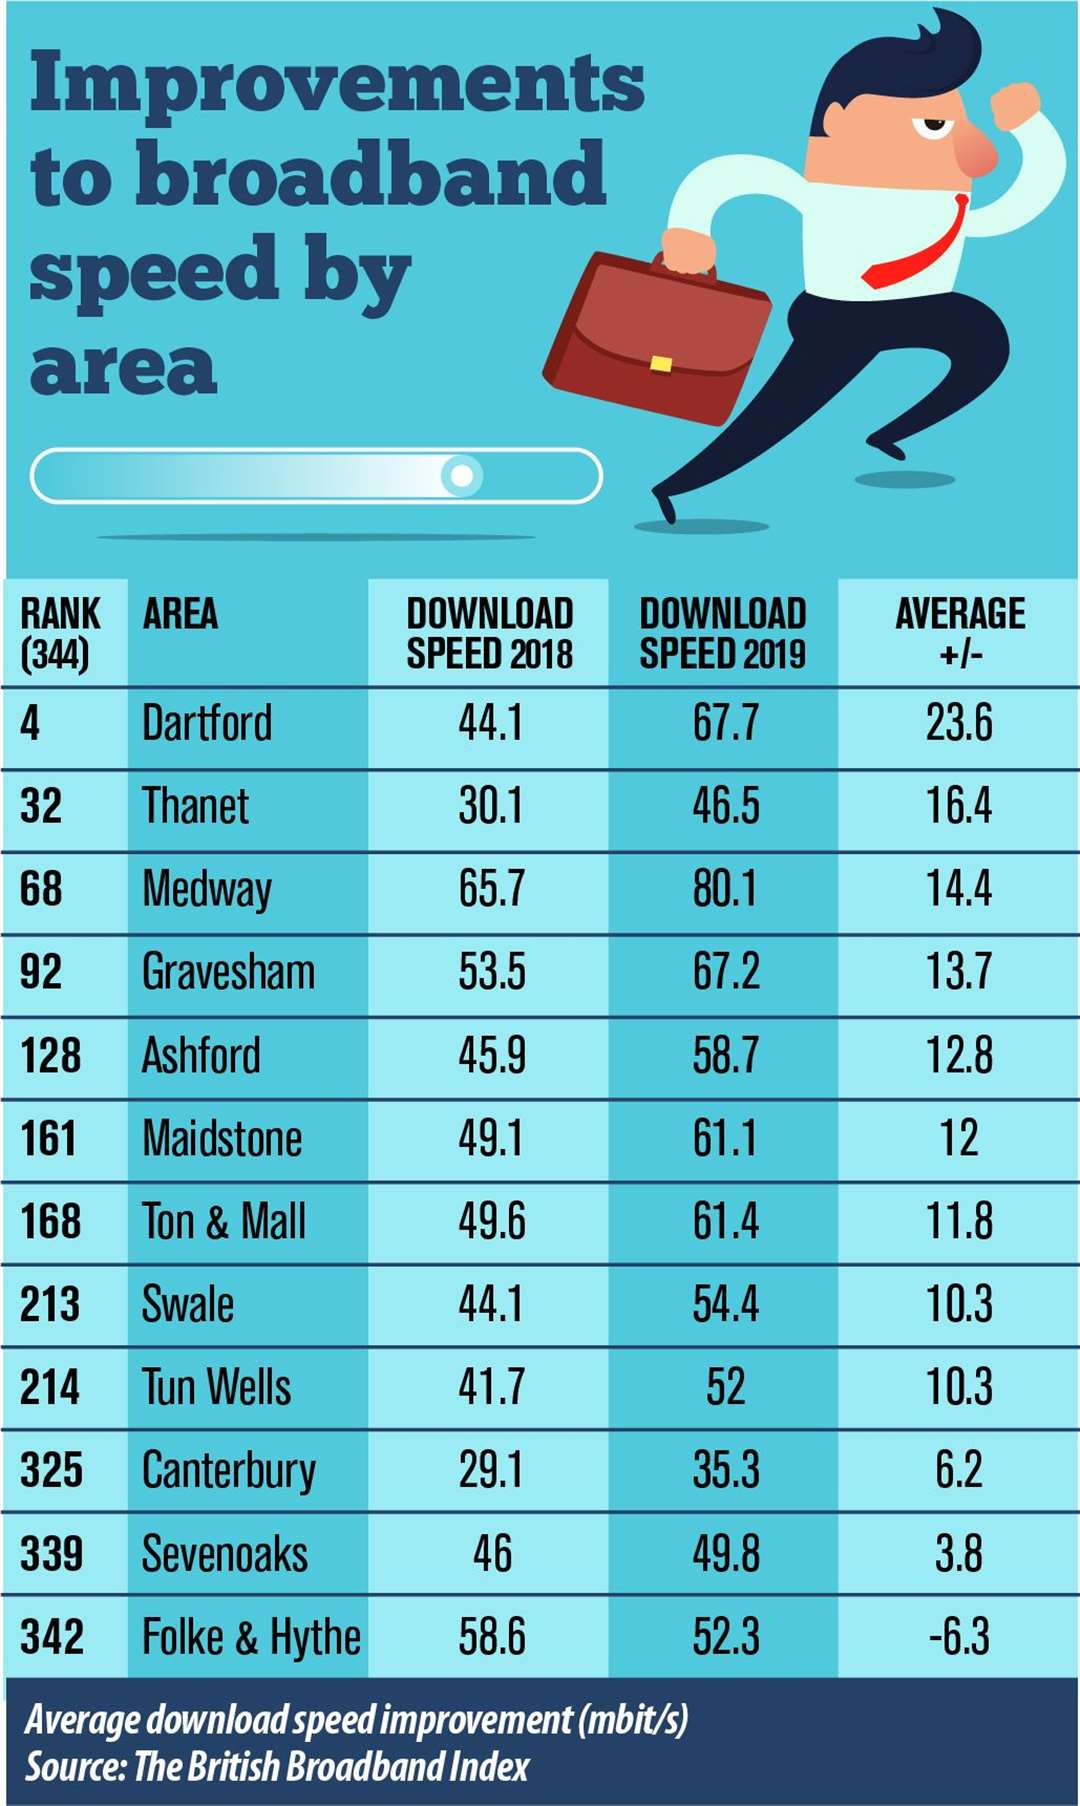
New statistics show how much broadband speed has improved in districts around the UK - with Dartford among the most improved nationwide, and Folkestone & Hythe among the few areas where speeds have slowed down.
Data published by comparethemarket.com shows how average broadband speed mostly improved across the country between 2018 and 2019, while some areas are being left behind.

The figures show Dartford is the fourth most improved out of 344 districts nationwide, with speed increasing from 44.1 to 67.7 Mbit/s. The next best Kent district on the list is Thanet, which ranked 32nd, with speed improving from 30.1 to 46.5 Mbit/s; while Medway is ranked 68th with speed improving from 65.7 to 80.1 Mbit/s.
Gravesham just makes it into the top 100, ranked 92, its speeds having improved from 53.5 to 67.2 Mbit/s.
At the bottom end of the scale is Folkestone and Hythe, ranked 342nd, where speed actually slowed down from 58.6 to 52.3 Mbit/s; while Sevenoaks is ranked 339th, its speeds having risen marginally from 46 to 49.8 Mbit/s, and Canterbury is ranked 325th, its already poor speed having only risen slightly from 29.1 to 35.3 Mbit/s.
Nationwide the most improved area is Kingston-upon-Hull in Yorkshire, where broadband improved from 76.5 to 131.4 Mbit/s, while the bottom ranked district was Daventry in Northamptonshire, where speed dropped from 60.8 to 46.1 Mbit/s.
The government’s standard of Universal Service Obligation (USO) dictates that premises must have a minimum of 10 Mbit/s download speed and 1 Mbit/s upload speed.