Unlimited Digital Access / Get £25 off your Annual Digital Subscription! Use code 25OFF
GET STARTEDMore on KentOnline
Unlimited Digital Access / Get £25 off your Annual Digital Subscription! Use code 25OFF
GET STARTEDMore on KentOnline
Home Folkestone News Article
Latest government data has revealed Folkestone and Hythe has the fastest growing coronavirus rate in the UK - while part of Sheppey has become the first Covid-19 hotspot in Kent.
Analysis of statistics released by public health authorities on Monday shows the district has recorded a 185% increase in positive tests over the past week - but the rate is still less than half the national average.

This is the highest percentage increase across England, Wales, Scotland and Northern Ireland, across all tiers.
From the week ending October 18, there were close to 18 positive Covid-19 cases per 100,000 people.
But this jumped in seven days, to just over 50 positive cases in every 100,000 people in the week ending October 22.
It is one of only 11 areas where cases have doubled in a week, three of which are in Kent.
Cases climbed, per 100,000 people, from 47 to 102 in Gravesham , a 118% increase, and from 48 to 97 in Dartford , a 102% increase.
It comes as Hythe Town Council shut its offices after a positive test.
While the percentage hike is steep, the rate of infection is still way below the UK average.
Folkestone and Hythe's cumulative rate is 853 cases per 100,000 people, compared to Blackburn with Darwen, in Tier 3, where more than 3,600 cases have been recorded so far.
The absolute change in that area over the past two weeks is 240 cases from 515 to 755, which only measures as a 47% increase.
Areas such as Chesterfield in Derbyshire, now in Tier 2, have experienced a case increase in the same weeks from 139 to 296 - an increase of 112%.
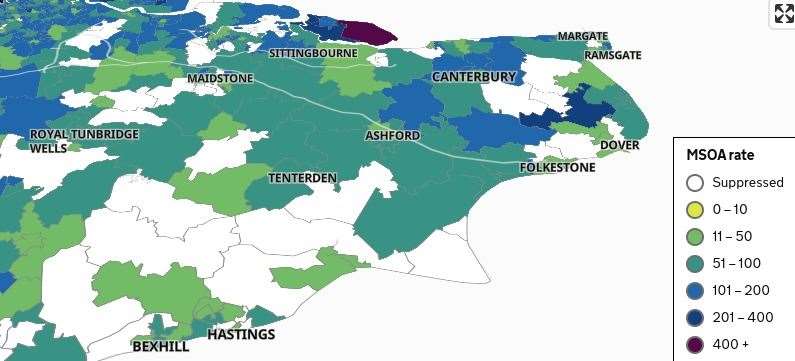
Meanwhile a government map charting case rates across the UK has highlighted Sheppey East as having a rolling rate of 427.4 cases per 100,000, making it the first area in the county to be given the highest 'purple' rating.
The rate puts the ward on a par with Nottingham but still some way behind Tier 3 Manchester.
It recorded 37 cases in the week to October 22, which was up 20 from the week before, but part of this can be attributed to the three prisons that it is home to, at least one of which has recorded a high number of cases.
But many parts of Kent remained at the other end of the scale with negligible growth - some recording fewer than three cases in a week with their data suppressed as a result.
The county as a whole recorded 1,179 new cases in the seven-day period, an increase of 51% week-on-week. The previous week saw a rise of just 9%.
The rate here for the week ending October 22 was 74,5, putting the county in the middle of the government's scale.
Of the nine regions across England, the South East remains one of the least affected areas in terms of individual case numbers.
It has so far recorded 69,021 positive cases of Covid-19 - a rate of 751.9 per 100,000 population.
The North West remains the worst affected region, with 195,127 positive cases - a rate of 2,658 per 100,000 population.
But the R rate in the South East is now higher than other regions across England.
It is currently at 1.2-1.5 with a growth rate per day of 4 to 7%.
Only the South West is recording a higher R rate of 1.3-1.6, with a growth rate per day of 5 to 9%.