GO AD-FREE. Get 2 Months Digital Subscription for ONLY £1! Use code 2FOR1
GET STARTEDMore on KentOnline
GO AD-FREE. Get 2 Months Digital Subscription for ONLY £1! Use code 2FOR1
GET STARTEDMore on KentOnline
The places in Britain with the most and least air pollution have been revealed in a new ground-breaking study.
Sadly Kent came out with the worst pollution.
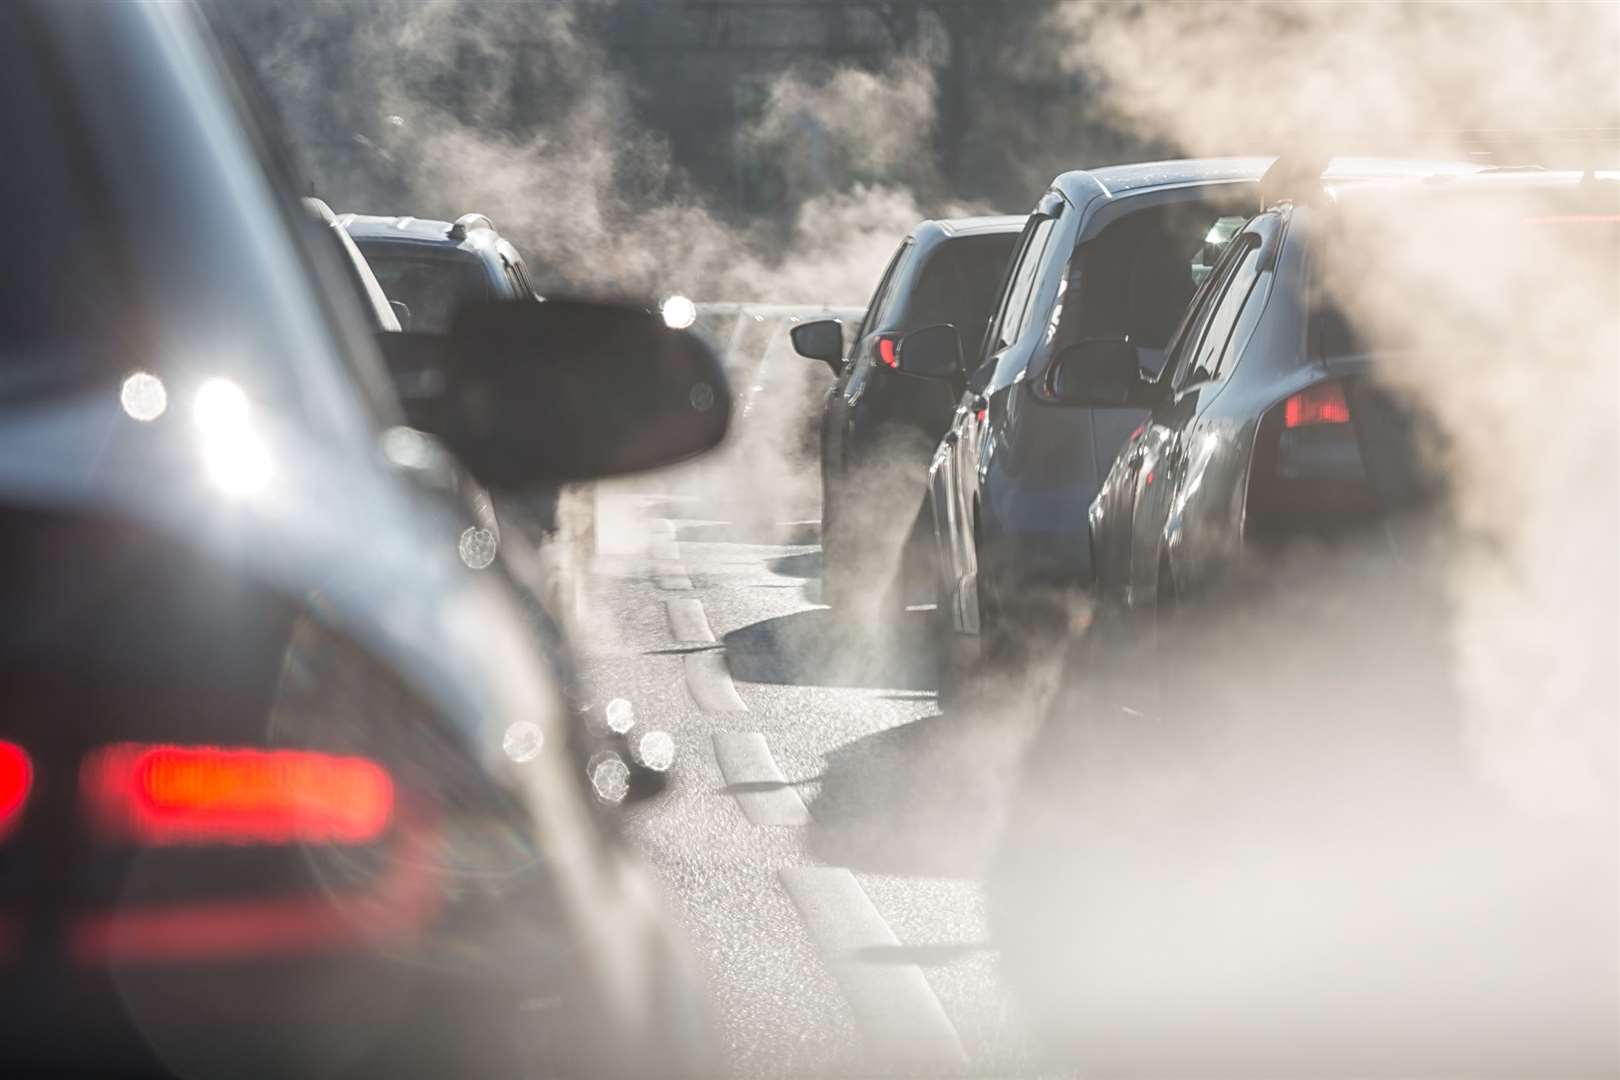
Researchers say they can now look at air pollution across England, Scotland, and Wales in never-before-seen detail thanks to the use of satellites and artificial intelligence.
The new technology is so good that scientists can record levels of pollution in each individual square kilometre of the country.
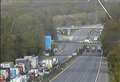
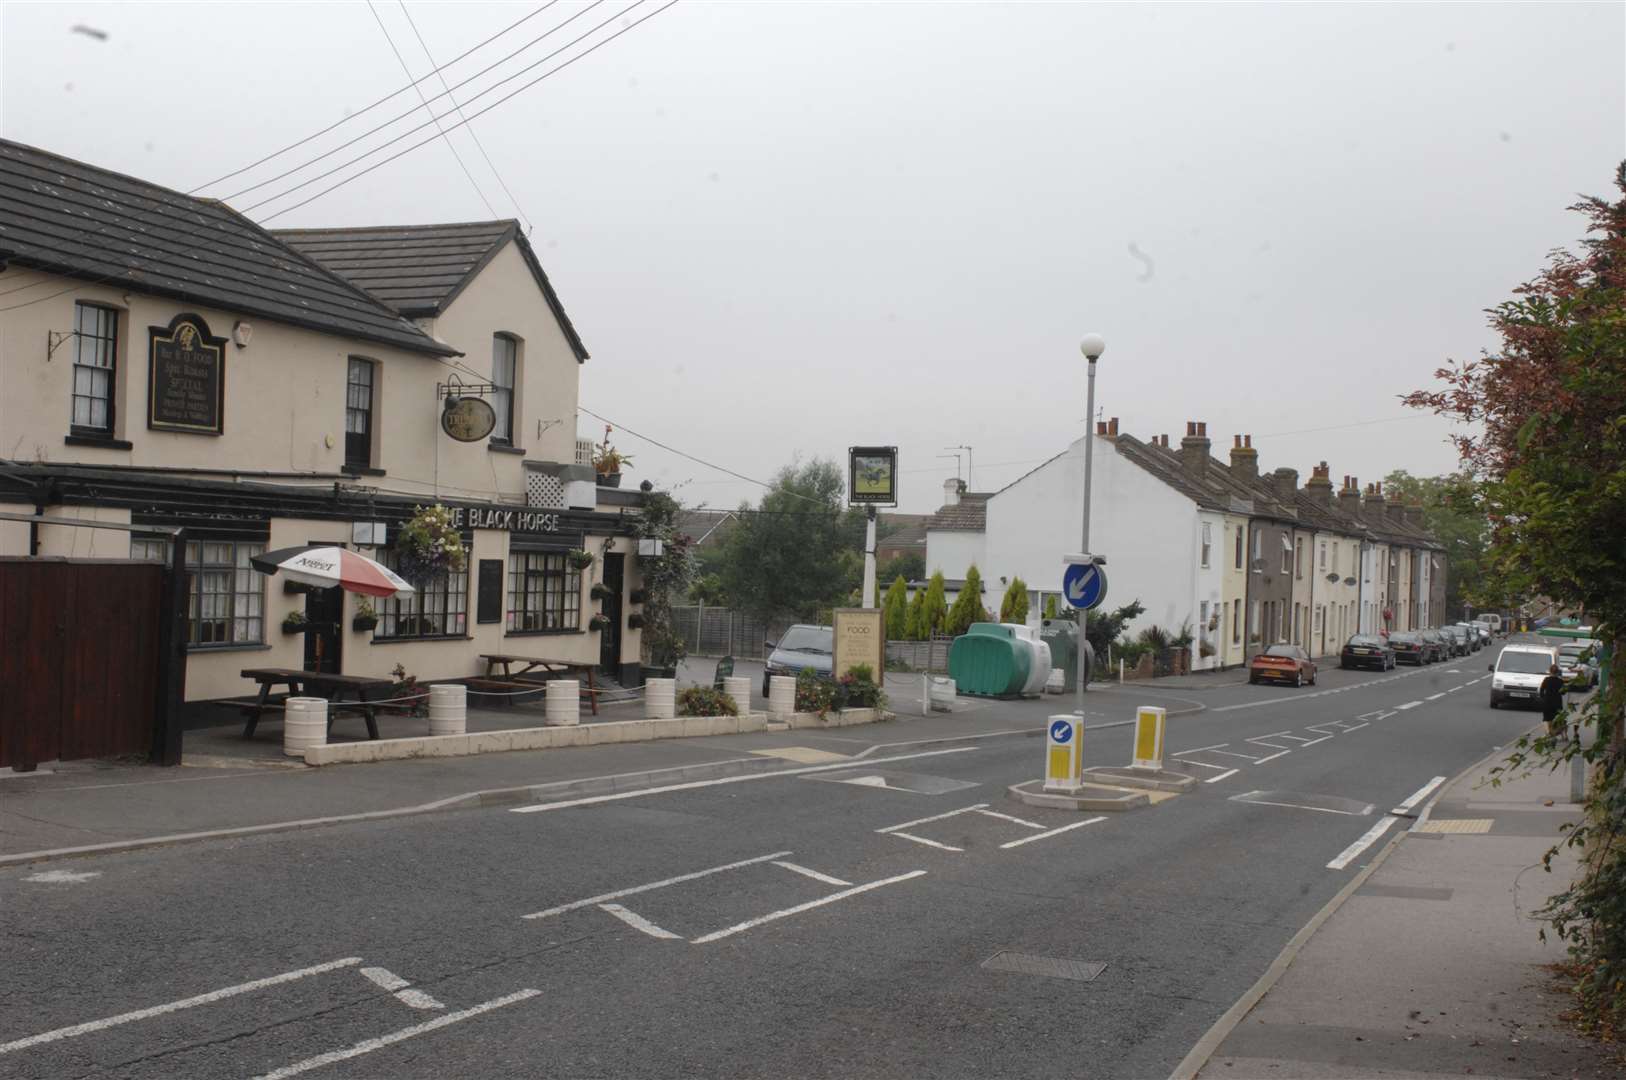
They found that the square kilometre with the worst air quality in 2018 - the most recent year for which data is available - was alongside the A282 Dartford Tunnel approach road to the north of Bean. It is close to the Bluewater Shopping Centre and the Darent Valley Hospital.
By contrast, the least polluted square mile was found at the isolated Ardlamont House near the village of Tighnabruaich in Argyll, Scotland.
The Kent location was recorded as having 23 micrograms of pollutants per cubic metre of air throughout the year - more than double the World Health Organisation's (WHO) recommended guideline of just 10.
Meanwhile, visitors to the remote island in Scotland have been breathing easy with an average of just four micrograms per cubic metre.
The team behind the latest models say their research has made it possible to have data accurate enough to carry out nationwide studies on how air quality is affecting our health.
Currently, researchers rely on equipment on the ground to monitor air pollution. The devices are mostly found in towns, meaning the accuracy of information falls short.
But the new study combined readings from existing ground-based monitors with data from satellites, which provided information on weather patterns, aerosols suspended in the atmosphere, land use and vegetation cover.
They also used data on population density, road density and the location of airports. In all, the team gathered data across 10 years from 2008 to 2018.

With the help of AI, they used the data to predict the levels of ultra-small particles, less than 2.5 micron in size, called PM2.5 which are the most dangerous because they are small enough to work their way past the nose and throat and get deep into the lungs and blood-stream.
The WHO estimates there are 7m deaths per year worldwide due to air pollution, which causes lung disease, lung cancer, heart disease and strokes.
The research was carried out by the London School of Hygiene and Tropical Medicine which now intends to combine the data with local health records to get the full picture for the UK.
Prof Antonio Gasparrini, professor of biostatistics and epidemiology at the college and the senior author of the study, said: "This demonstrates how cutting-edge techniques based on artificial intelligence and satellite technologies can benefit public health research.
"The output reveals the shifting patterns of air pollution across Great Britain and in time with extraordinary detail."
He said: "We now hope to use this information to better understand how pollution is affecting the nation's health, so we can take steps to minimise the risk.
"The vast amount of data produced will provide a vital tool for public health researchers investigating the effects of air pollution."
The research has been published in the journal Remote Sensing.