GO AD FREE | Get your Digital Subscription for only 50p a week! Use code SUMMER
GET STARTEDMore on KentOnline
GO AD FREE | Get your Digital Subscription for only 50p a week! Use code SUMMER
GET STARTEDMore on KentOnline
The popular perception is of Kent being hidden beneath an ever-expanding carpet of housing. The reality, however, is certain to surprise you.
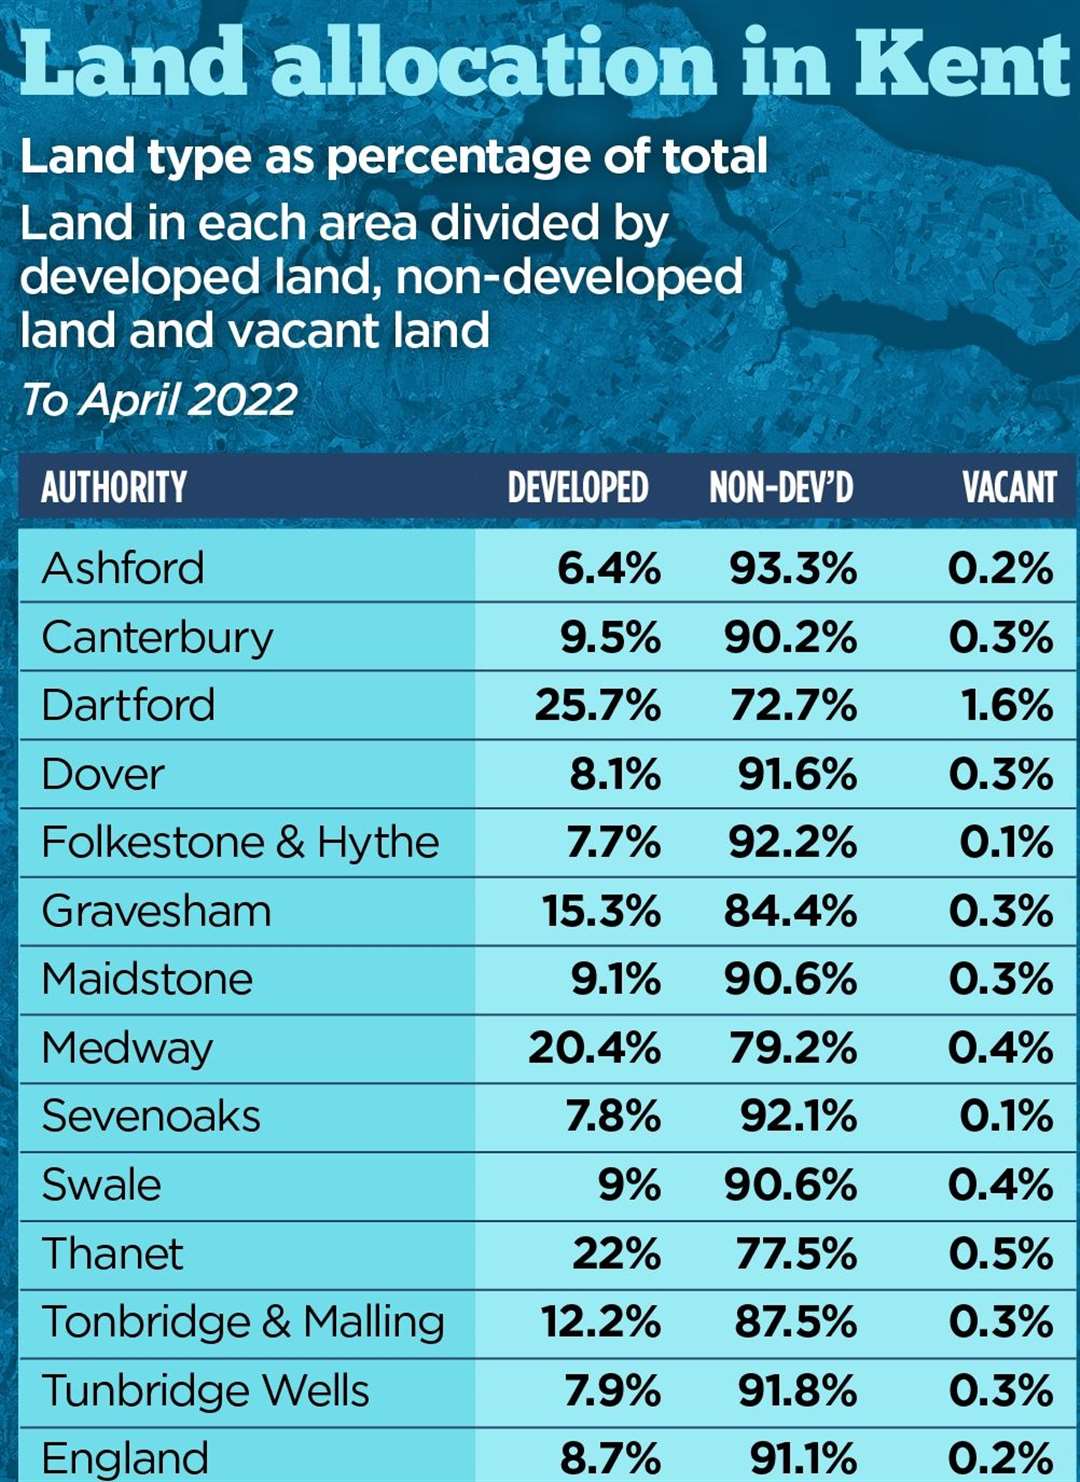
According to data, only four of the county’s districts – plus Medway – have more than 10% of their total area developed.
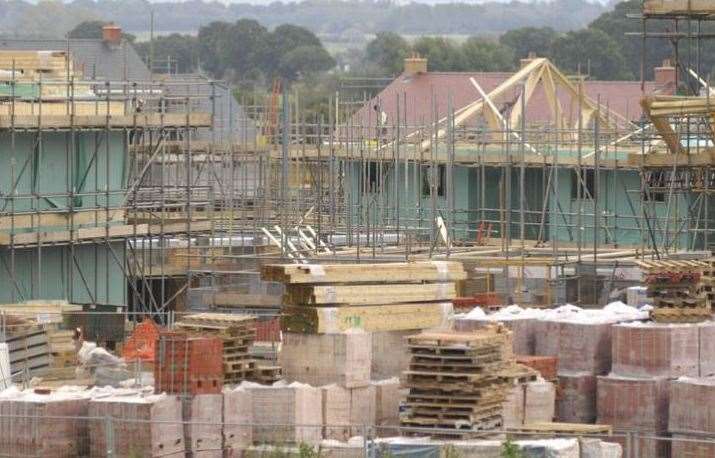
In fact, only one has more than 25% built on. Perhaps more surprising is that housing doesn’t even claim the lion’s share of development.
The land use statistics were released by the Department for Levelling Up, House and Communities. They include figures up to April 2022 and are shared by Kent County Council.
It breaks down the statistics for each local authority area to paint a picture of just how much of each form of development exists.
It makes for fascinating reading.
To put everything into context, nationwide, an estimated 91.1% of all land in England was classified as undeveloped.
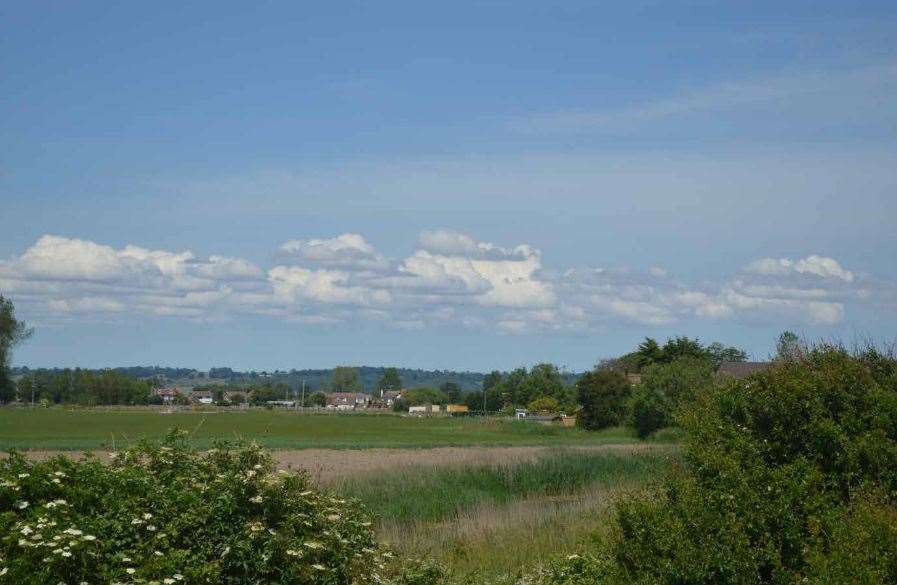
This category includes everything from woodland, agricultural land (and buildings), parks to back gardens.
Some 8.7% is developed – which, as you can guess, includes housing, transport infrastructure (including road and rail) and commercial use.
Just 0.2% was classed as ‘vacant’ – in other words land not falling into either of the other two categories and not obviously part of a property.
All of which rather flies in the face of claims that the country is being swamped by new housing developments – however much it feels we are.
In Kent, five districts – and remember these stretch beyond the towns around which they are centred and into surrounding rural areas – are below the national average.
They are Ashford which has 93.3% of its land classified as undeveloped (the highest proportion in the county), Folkestone & Hythe (92.2%), Sevenoaks (92.1%), Tunbridge Wells (91.8%) and Dover (91.6%).
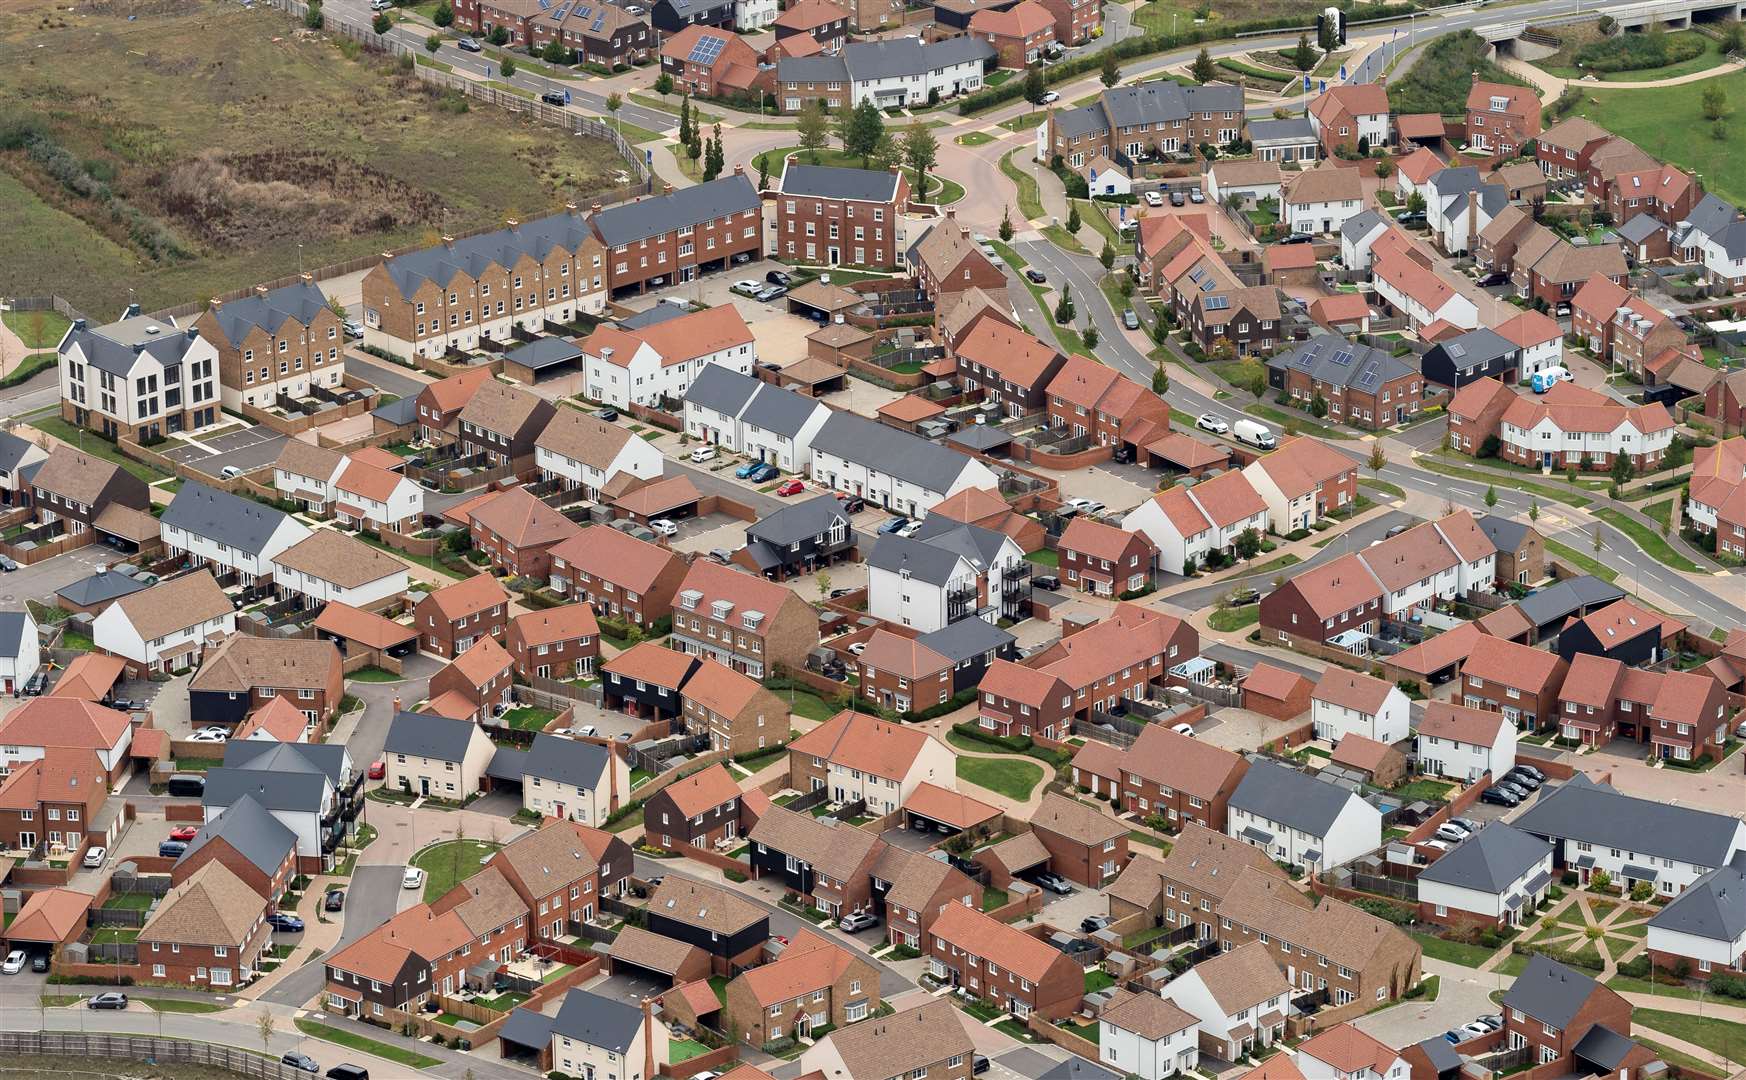
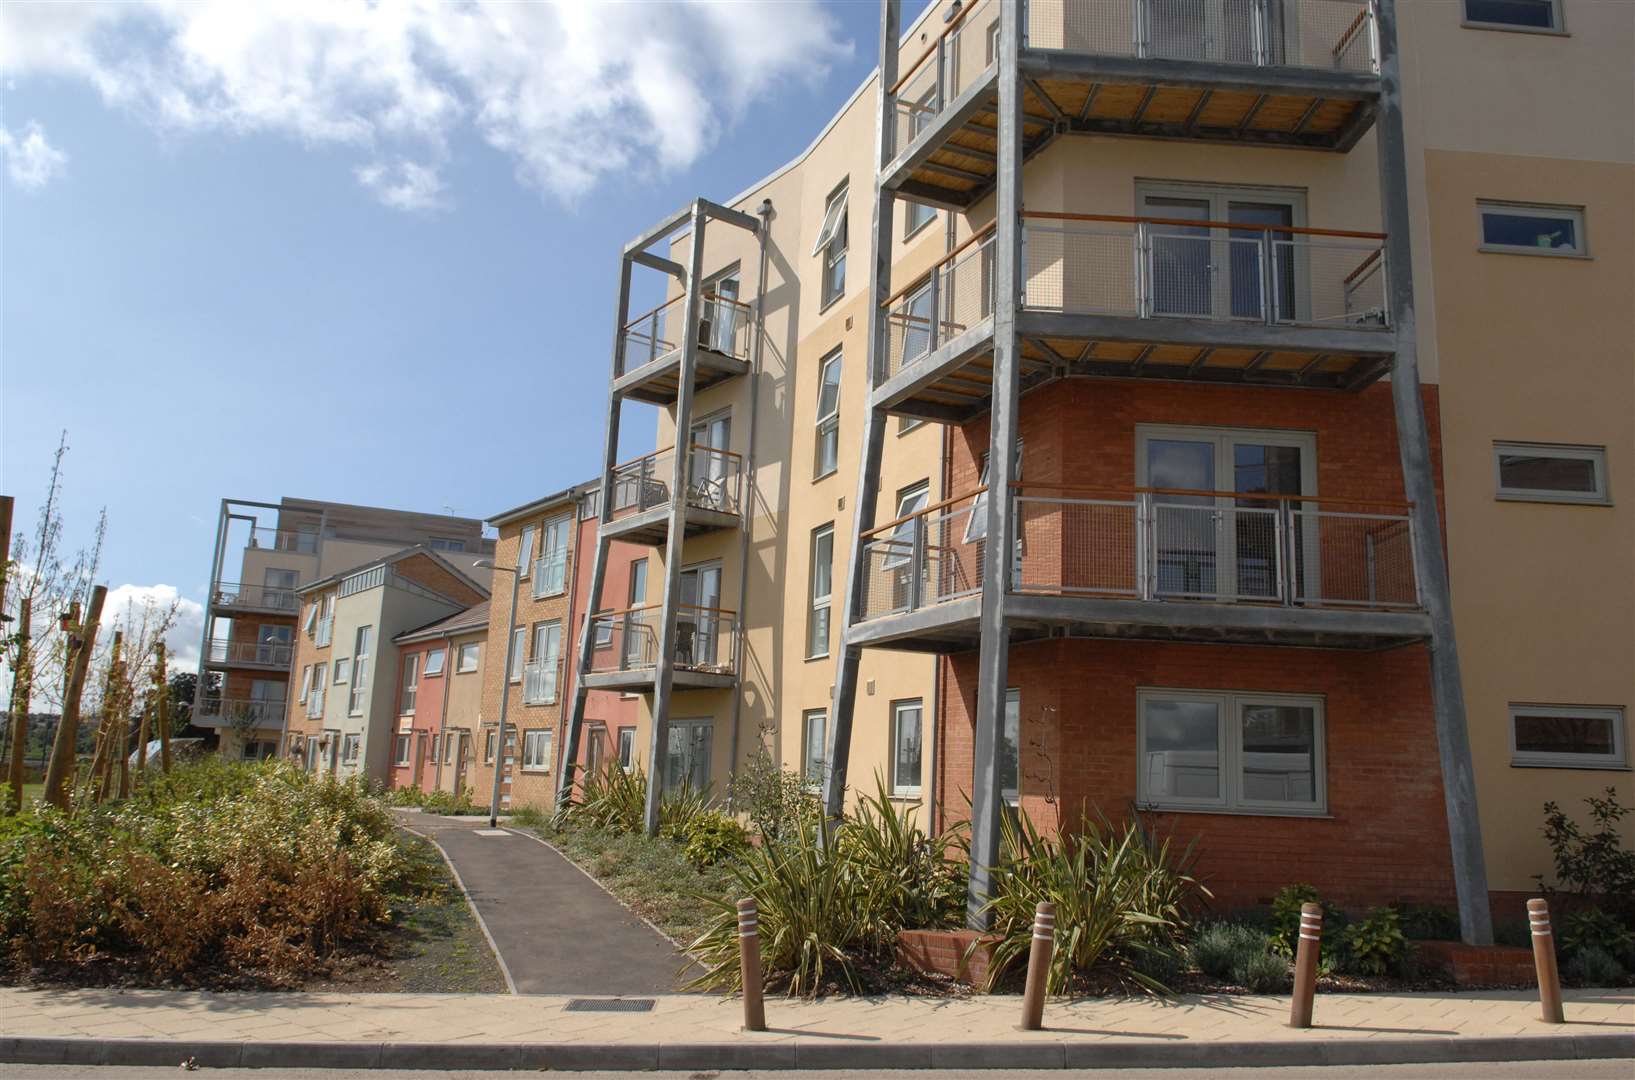
The amount of undeveloped land in and around the Ashford district may surprise many. As we revealed earlier this month, it has seen one of the highest number of new homes built – with 2,500 over the last five years alone.
Maidstone, which topped that development list – with 5,340 over the last five years – has, according to the government figures, just 9.1% of its land developed.
So just why is the perception quite the opposite? The answer almost certainly lies in the fact new housing tends to spring up close to existing settlements in order to be able to tap into pre-installed utilities and around existing transport infrastructure – in other words our roads. In short, the vast majority of building is very visible.
Back to the statistics. Dartford, which has seen 3,340 new homes in recent years, is the most developed part of the county.
It has seen 25.7% of its total land area built on.
Worth factoring in is that Ashford is the single largest district in terms of hectares (it has 58,062) compared to Dartford, which is the smallest at 7,273.
Thanet has the second highest percentage of developed land at 22%. Medway is next at 20.4%.
So what, you may ask, comprises the biggest share of the development in all our areas? Housing, surely? Think again.
In every district and unitary authority in Kent, housing is only the second biggest contributor to what constitutes ‘developed’.
The biggest single use of land is for transport and utilities.
So if we take Canterbury, for example, the district – which embraces Whitstable and Herne Bay – has 90.2% of its total area classed as non-developed land, with 9.5% as developed.
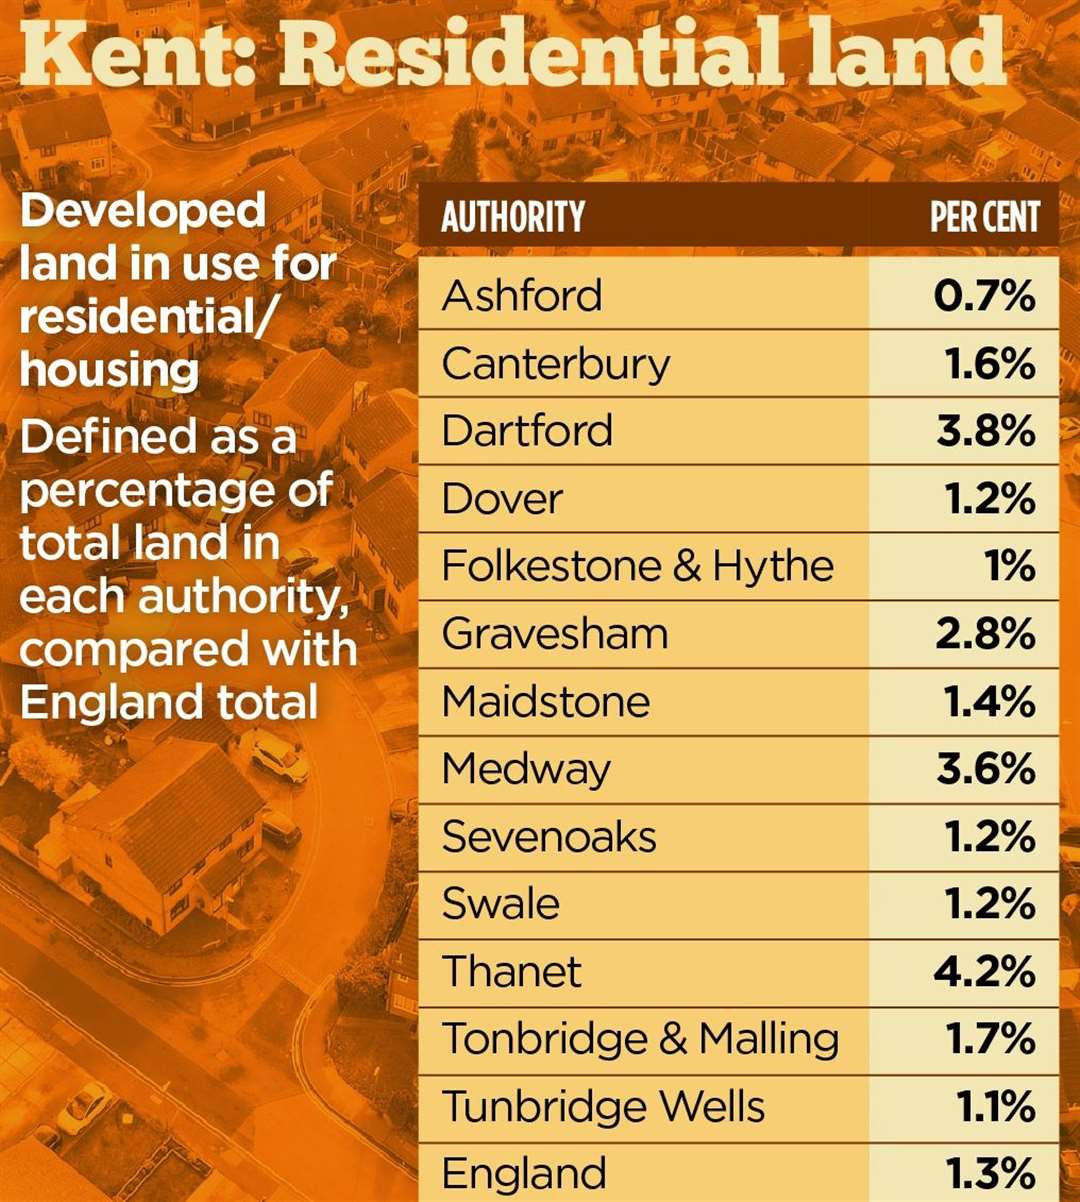
Of that development, 4.6% is taken up by transport and utilities. Meanwhile, 1.2% is classed as ‘community service’ – so that’s community buildings, leisure and recreational buildings. Residential lays claim to a mere 1.6% of the district’s developed land.
Of Dartford’s 25.7% of developed land, residential accounts for just 3.8%. Transport and utilities, on the other hand, stands at 11.8% – the highest in the county. In Ashford, residential eats up just 0.7% – transport and utilites at 3.6%.
The district which has the highest share of its developed land for residential purposes is Thanet at 4.2%. It also has the second highest transport and utilites use at 11%.
Further surprising is that the bulk of our districts have less than 2% devoted to residential. Folkestone and Hythe is second only to Ashford with 1% used for homes. Tunbridge Wells is 1.1% followed by Sevenoaks and Swale (both 1.2%) and Maidstone at 1.4%.
The national average is 1.3%.
Perhaps not surprisingly, given Kent’s over-used moniker of the Garden of England, the biggest use of non-developed land is for agriculture.
In Dover, for example, it accounts for 71.1% of its 91.6% of undeveloped land. In Ashford it’s 69.5% and Folkestone and Hythe it’s 68.6%. Swale’s agricultural share is 66.3% and Maidstone’s 65%. Dartford, meanwhile, is a mere 33.8% – comfortably the lowest in the county (Medway is next at 45%).
The national average is 63.1%.
So what, you may be asking, is the share of undeveloped land classed as residential gardens?
Well, of the 72.7% of undeveloped land in Dartford, 12.2% are front and back gardens. It’s the same percentage in Thanet.
Which would suggest both districts are closer to 60% developed if we factor in our private gardens too.
The national average for gardens is 4.9%.
Ashford is 4.7% while Medway is at 11.1%.
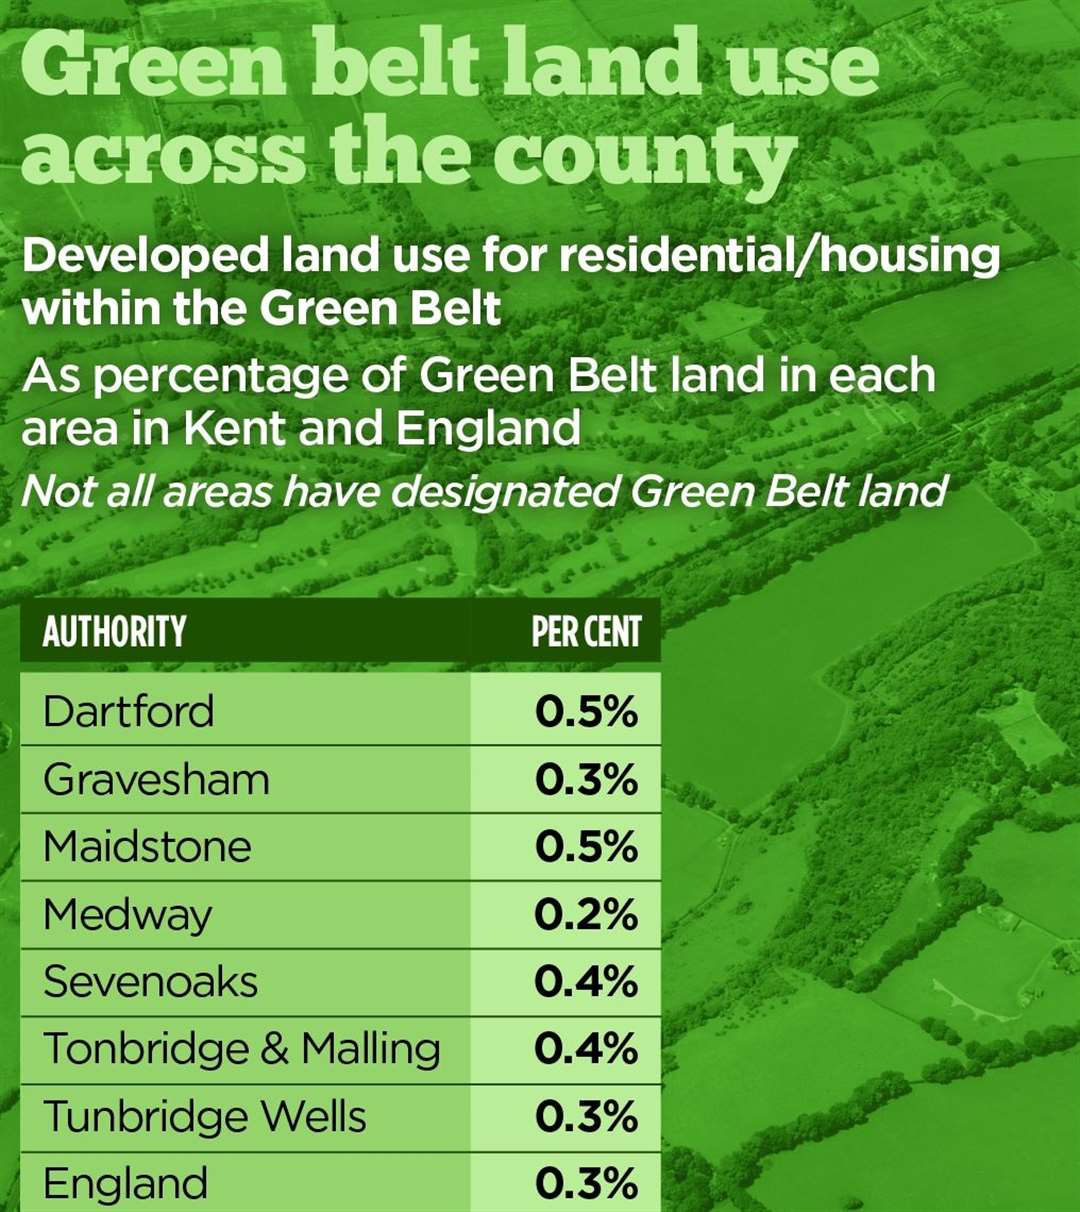
As for Green Belt development? Well, first let’s just remind ourselves that Green Belt is designed to stop urban sprawl of our cities (rather than a catch-all terms for development of ‘green field’ sites).
Therefore, only those districts whose borders butt onto Greater London will be impacted in Kent.
They are: Sevenoaks (92.9% of the district sits within the Green Belt), Gravesham (76.8%), Tonbridge & Malling (71%), Dartford (56.3%), Tunbridge Wells (21.5%), Medway (6.9%) and Maidstone (1.3%).
Green Belt development is normally only permitted in exceptional circumstances – if at all.
Dartford once again emerges top with 11% of its Green Belt developed. Transport and utilites taking the biggest chunk (5.9%).
Medway has the least developed at just 3.4% (the vast majority of which – 2.6% – is taken by transport and utilities).
In all cases, residential use in the county in the Green Belt accounts for less than 1%.
Property expert Spencer Fortag runs Dockside Properties in Medway. He says the figures are worth remembering amid concerns over the number of new developments around the county.
He says: “England is pretty much 92% open space, so how on earth can we have a home-building shortage issue? The land is there.
“I'm not for one second suggesting we build huge housing estate on areas of outstanding natural beauty, but we could all point to a bit of land that is easily buildable on.

“There are numerous opportunities out there. The fact remains, there's a lot of land and we don't have enough homes for people to live.”
And finally, with all these new homes being built, it’s intriguing to discover just what sort of land they are being built upon.
According to a different data set from the same government department – but containing figures up to October 2022 – it reveals what land has been turned into residential areas between 2019 and 2022.
In England, over the three years between 2019 to 2022, some 58% of new residential property was on previously developed land – often refered to as ‘brownfield’ sites. The rest, 42%, on undeveloped ‘green-field’ sites.
The local authority with the highest proportion of homes built on previously developed land was Canterbury with 54% of its new housing being built on ‘developed’ land.

Perhaps unsurprisingly given the amount of undeveloped land within the district, Ashford’s new housing swung in the opposite direction with 78% built upon previously undeveloped land. The data reveals 53% of that was on agricultural land.
Tunbridge Wells has the second highest percentage of new homes on green-field sites with 72%, followed by Gravesham (66%) and then Swale (63%).
So next time you say all of Kent is concrete – think again.