GO AD-FREE. Get 2 Months Digital Subscription for ONLY £1! Use code 2FOR1
GET STARTEDMore on KentOnline
GO AD-FREE. Get 2 Months Digital Subscription for ONLY £1! Use code 2FOR1
GET STARTEDMore on KentOnline
Rents in Kent have risen more than five times faster than the average monthly salary, a study has revealed.
GMB Southern Region has published data showing a dramatic increase in the median monthly rent for a two-bedroom property in the county.
On average, prices increased by 21% between 2011 and 2017, while monthly earnings have risen by just 4%.
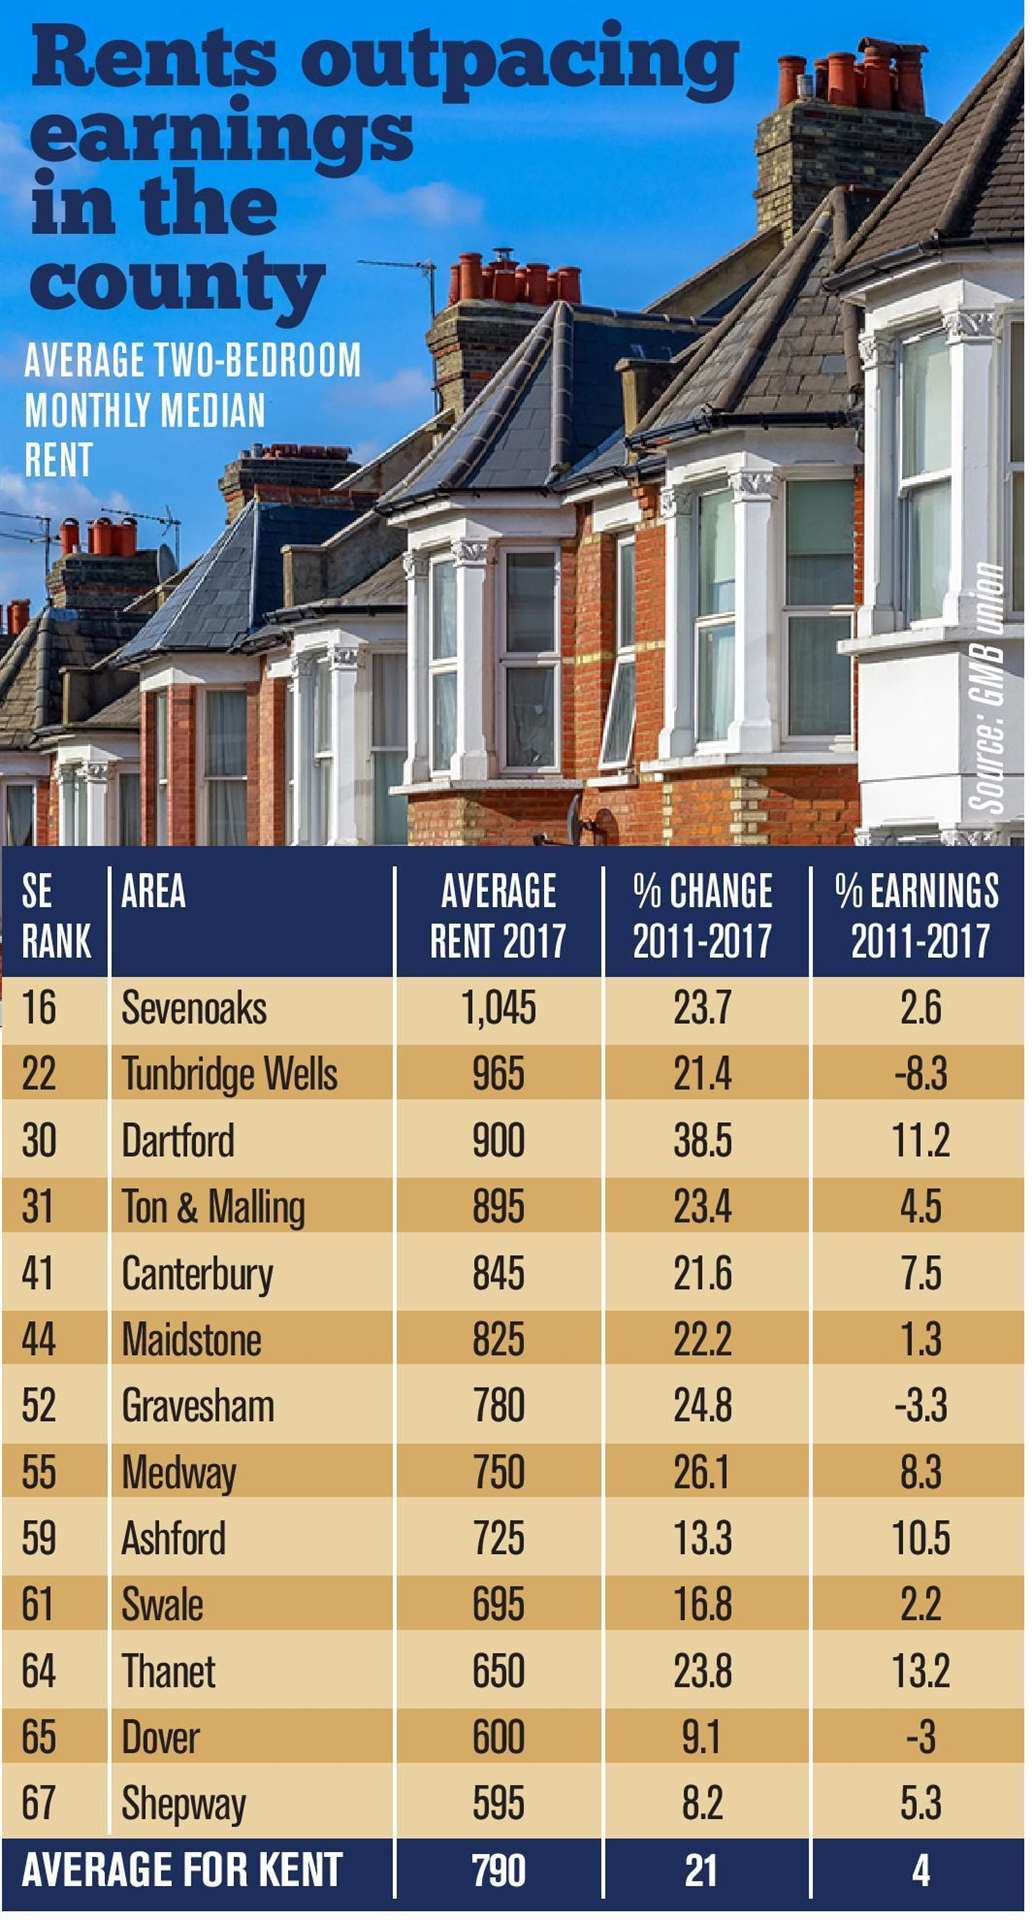
Growing costs have hit areas such as commuting hotspot Dartford hardest, a popular place for those who decide to move out of the capital.
The median monthly cost of renting a two bedroom home in the borough increased by almost 40% between 2011 and 2017, however, on average, wages rose by just 11%.
Tunbridge Wells and Gravesham have also been badly affected, as while rents continue to go up in each area, monthly earnings have actually decreased.
In Tunbridge Wells, the median monthly rent for a two bedroom property rose by 21% between 2011 and 2017, whilst earnings fell by 8%.
Similarly, in Gravesham, monthly rent increased by 25% over the same time period, whilst monthly wages decreased by 3%.

The most expensive place to rent, however, was named as Sevenoaks, the only place in Kent where the monthly median rent for a two bedroom property is more than £1,000.
The study comes after property website RightMove named the places with the highest growth in rents outside of London earlier this year.
Once again, Dartford topped the list, Gillingham had joint-third highest growth, whilst Sevenoaks and Chatham ranked joint sixth.
For those searching for a cheaper place to live, it may be worth venturing further east.
The median monthly rent for a two bedroom home in Dover increased by 9% between 2011 and 2017, whilst Shepway saw an increase of just 8%.
However, monthly earnings in each area are lower than average, with wages in Dover falling by 3% during the same time period.
Workers in Shepway didn't fare much better, with earnings increasing by 5% between 2011 and 2017.