GO AD-FREE. Get 2 Months Digital Subscription for ONLY £1! Use code 2FOR1
GET STARTEDMore on KentOnline
GO AD-FREE. Get 2 Months Digital Subscription for ONLY £1! Use code 2FOR1
GET STARTEDMore on KentOnline
The worst crime hotspots in Kent have been revealed as many people worry about levels of violence, drug dealing and antisocial behaviour where they live.
Figures collated by KentOnline below show the 11 most dangerous areas in the county, based on the number of crimes reported.
It come as figures earlier this year show violent crime in the county has increased by more than 25% in 12 months.
Kent has also seen the fastest rise in knife crime in the entire country.
Some communities have decided to take action, with groups set up to prevent children getting involved in county lines gangs, which sells drugs supplied by organised crime in London.
Listed below are the 11 locations with the highest number of crimes reported to the police in April this year, the most recent available figures.
The range in crime statistics across 308 wards in the county's 13 districts is huge, with hundreds of reports in some areas each month, but just one or two in others.
Here are Kent's 11 most dangerous areas:
1. Medway - River - 270 crime reports

Worst street in the ward: In or near Solomons Road. There were 29 incidents reported to police in April, including eight violent or sexual offences, two robberies and two burglaries.
Violence and sexual offences = 74
Anti-social behaviour = 64
Public order = 27
Criminal damage and arson = 23
Shoplifting = 23
Other theft =15
Drugs = 8
Robbery = 8
Burglary = 7
Theft from a person = 6
Vehicle crime = 6
Other crime = 5
Bicycle theft = 2
Possession of weapons = 2
2. Canterbury - Westgate - 248 crime reports
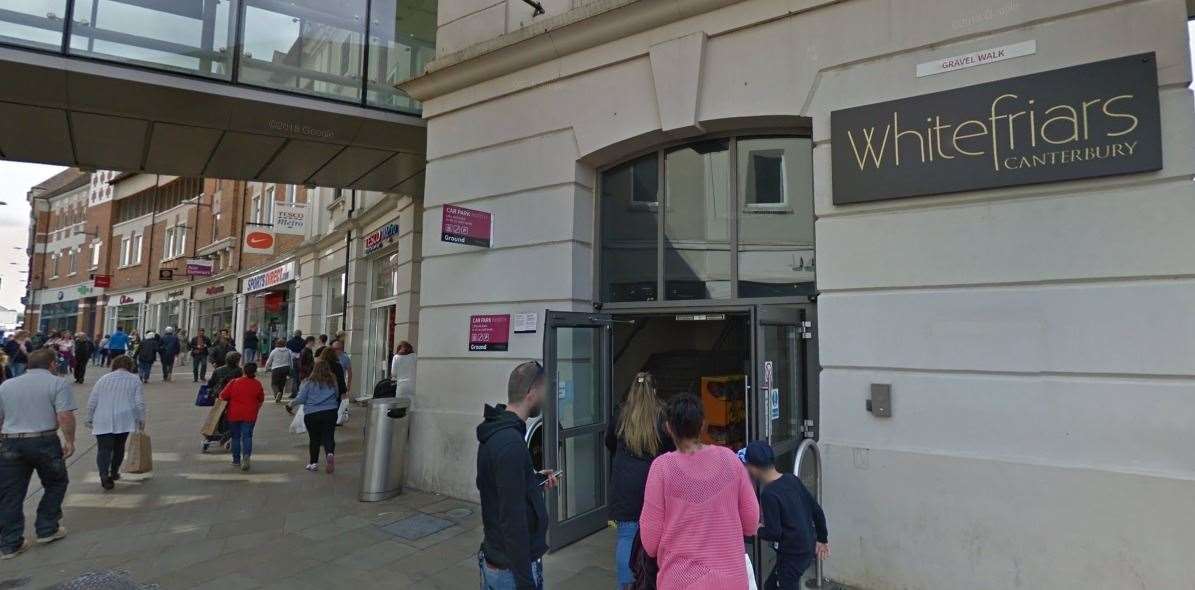
Worst street in the ward: In or near Whitefriars shopping centre, with 56 reports during the month, including 12 violent crimes and 19 cases of anti-social behaviour.
Anti-social behaviour = 72
Violence and sexual offences = 54
Criminal damage and arson = 29
Shoplifting =24
Vehicle crime = 20
Public order = 17
Other theft = 12
Drugs = 6
Theft from a person = 5
Bicycle theft = 3
Burglary = 3
Other crime = 2
Robbery = 1
3. Maidstone High Street - 234 crime reports
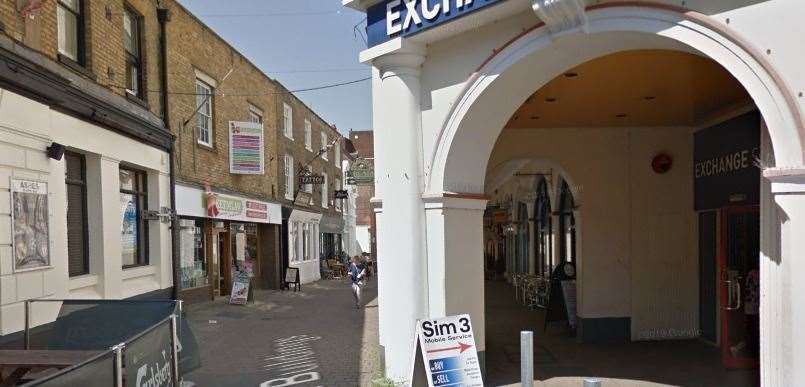
Worst street in the ward: In or near Market Buildings. There were 28 crime reports to police during April, including 13 anti-social behaviour incidents and six drug-related incidents.
Violence and sexual offences = 70
Anti-social behaviour = 61
Shoplifting =23
Public order = 20
Other theft = 16
Criminal damage and arson = 15
Drugs = 11
Vehicle crime = 6
Robbery = 3
Burglary = 3
Bicycle theft = 3
Possession of weapons = 2
Other crime = 1
4. Shepway - Folkestone Harvey Central - 193 crime reports
Worst street in the ward: In or near Oxford Terrace, with 16 police call-outs including nine counts of shoplifting and three violent or sexual offences.
Anti-social behaviour = 61
Violence and sexual offences = 47
Criminal damage and arson = 16
Shoplifting = 15
Public order = 14
Other theft = 9
Bicycle theft = 6
Burglary = 5
Vehicle crime = 5
Other crime = 5
Theft from a person = 4
Robbery = 3
Drugs = 2
Possession of weapons = 1
5. Thanet - Margate Central - 176 crime reports
Worst street in the ward: In or near Mill Lane, with a total of 15 reports, including two burglaries and two count of criminal damage or arson.
Anti-social behaviour = 74
Violence and sexual offences = 37
Criminal damage and arson = 13
Drugs = 11
Public order = 11
Other theft = 8
Vehicle crime = 5
Burglary = 3
Possession of weapons = 3
Robbery = 3
Shoplifting = 3
Other crime = 3
Theft from a person = 1
Bicycle theft = 1
6. Ashford - Victoria - 152 crime reports
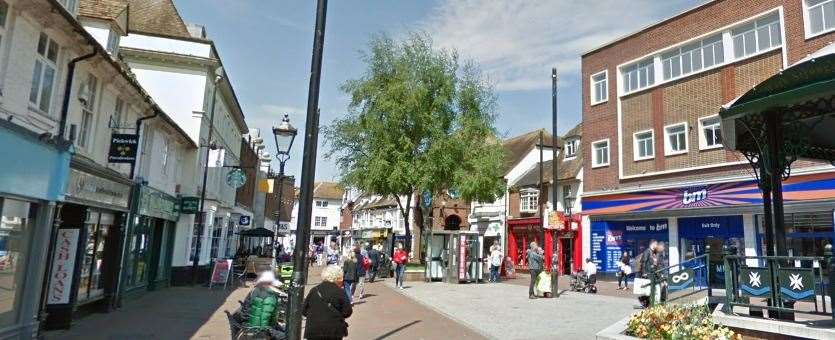
Worst street in the ward: In or near High Street. In April, there were 18 incidents reported to the police, including nine counts of anti-social behaviour and three counts of violence or sexual offences.
Anti-social behaviour = 48
Violence and sexual offences = 44
Public order = 18
Shoplifting = 14
Other theft = 11
Robbery = 4
Drugs = 4
Burglary = 3
Criminal damage and arson = 2
Theft from a person = 2
Possession of weapons = 1
Vehicle crime = 1
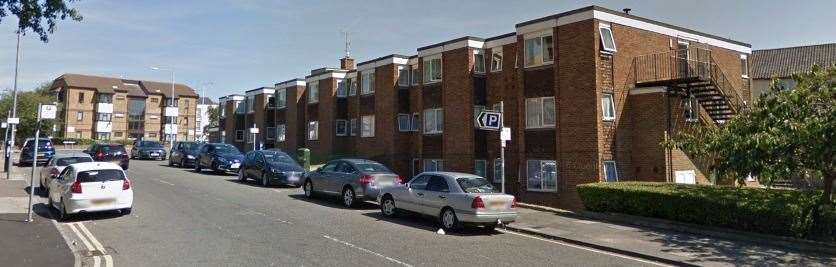
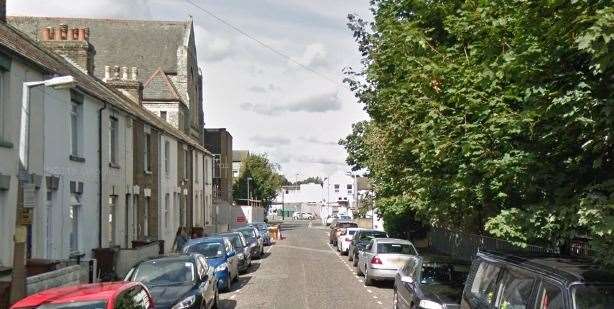
7. Medway - Rochester West - 137 crime reports
Worst street in the ward: In or near Sir Evelyn Road, with a total of 33 reports, including 29 violent or sexual offences.
Violence and sexual offences = 61
Anti-social behaviour = 32
Vehicle crime = 12
Criminal damage and arson = 7
Public order = 7
Other theft = 7
Other crime = 4
Robbery = 2
Burglary = 2
Possession of weapons = 1
Theft from a person = 1
Bicycle theft = 1
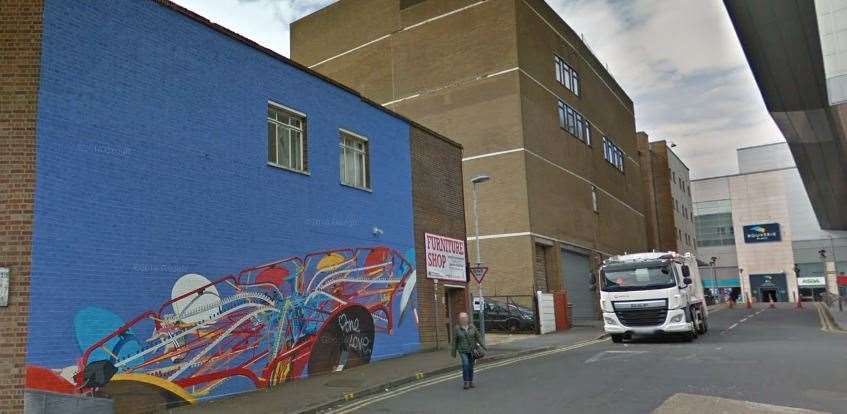
8. Medway - Strood South - 133 crime reports
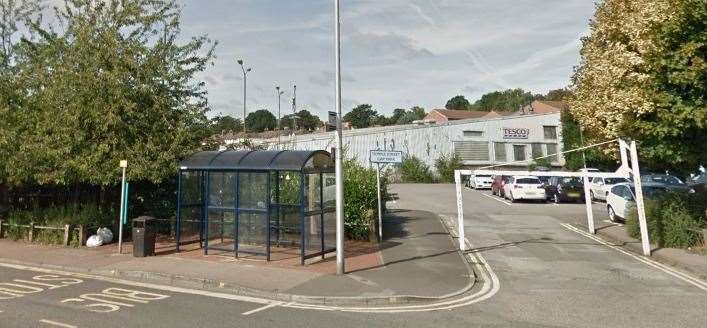
Worst street in the ward: In or near Temple Street Car Park, with 14 reports including five public orders and six violent or sexual offences.
Violence and sexual offences = 44
Anti-social behaviour = 31
Public order = 15
Shoplifting = 11
Vehicle crime = 10
Other theft = 8
Criminal damage and arson = 5
Other crime = 3
Robbery = 2
Possession of weapons = 1
Drugs = 1
Burglary = 1
Bicycle theft = 1
9. Dartford - Stone - 121 crime reports

Worst street in the ward: Bluewater shopping centre with 48 incidents comprising mostly of 38 shoplifting offences.
Shoplifting = 49
Anti-social behaviour = 17
Violence and sexual offences = 16
Vehicle crime = 12
Other theft = 9
Drugs = 5
Public order = 5
Other crime = 3
Burglary = 2
Criminal damage and arson = 2
Possession of weapons = 1
10. Gravesham - Pelham - 121 crime reports
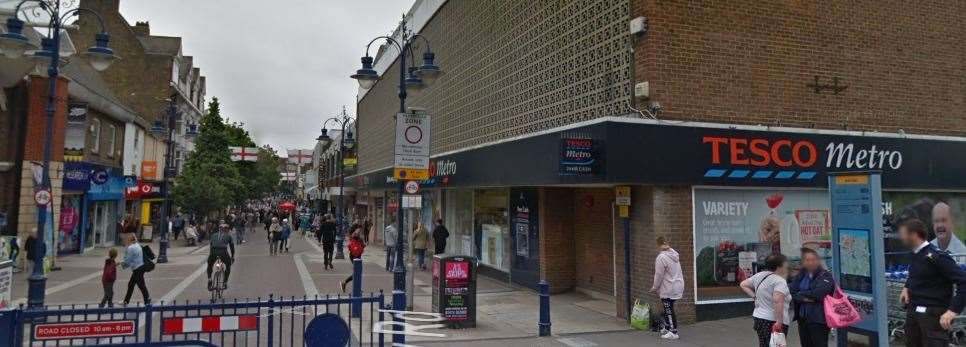
Worst street in the ward: Near Tesco Metro in New Road, Gravesend. A total of 25 incidents were reported here, including 10 counts of shoplifitng and 3 vehicle crimes.
Anti-social behaviour = 34
Violence and sexual offences = 33
Shoplifting = 17
Vehicle crime = 8
Other theft = 8
Criminal damage and arson = 6
Possession of weapons = 3
Burglary = 3
Public order = 3
Drugs = 2
Robbery = 1
Theft from a person = 1
Bicycle theft = 1
Other crime = 1
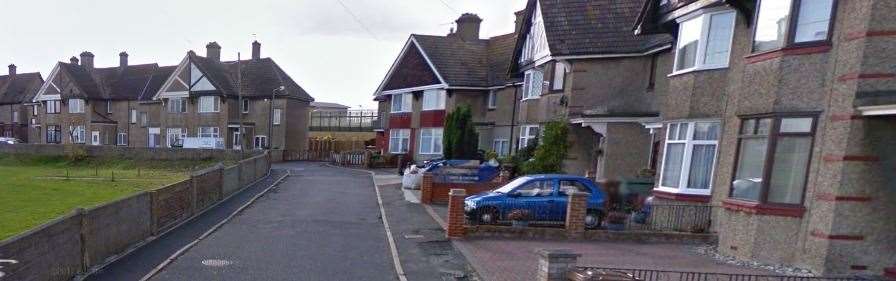
11. Medway - Gillingham South - 121 crime reports
Worst street in the ward: On or near Green Street, with eight of the nine reports being anti-social behaviour.
Violence and sexual offences= 40
Anti-social behaviour = 26
Public order = 14
Criminal damage and arson = 12
other theft = 8
Robbery = 6
Vehicle crime = 4
Drugs = 3
Burglary = 2
Shoplifting = 2
Other crime = 2
Possession of weapons = 1
Bicycle theft = 1